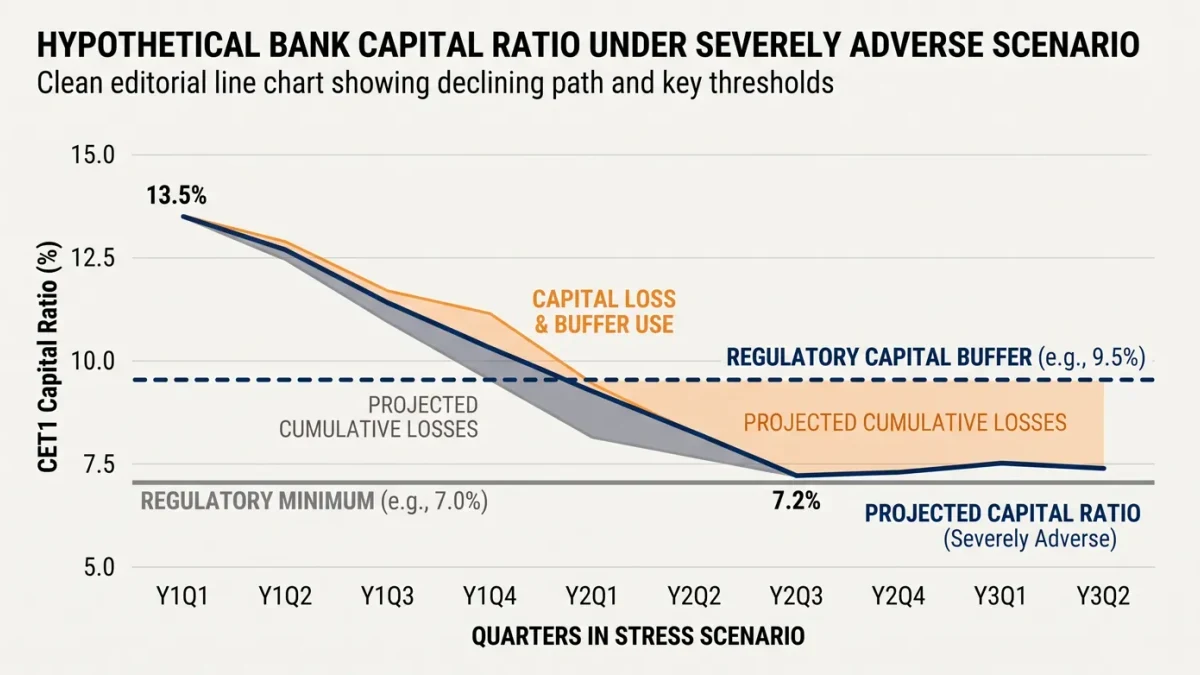

The Federal Reserve's 2026 stress test results, released June 24, 2026, projected nearly $708 billion in losses for 32 large banks under the severely adverse scenario with an aggregate peak-to-trough CET1 decline of 1.6 percentage points — and they arrive inside a documented methodology overhaul: in April 2025 the Board proposed averaging stress test results over two consecutive years to reduce volatility in capital requirements, with further proposals in October 2025 and a transparency rule published in November 2025.
Stress tests are models used as regulations — the output feeds each bank's stress capital buffer directly — so a methodological change is simultaneously a statistics question and a policy question. The averaging change is the latest and clearest example, and its comparability consequences deserve the same methodological treatment this site applies to any modified instrument.
What changed, and why?
Under the pre-2025 design, each year's scenario produced each bank's requirement afresh — scenario severity varied by design, and resulting buffers moved accordingly. The April 2025 proposal, noted in the Fed's own 2025 stress test documentation, would average results over two consecutive years so that a single year's scenario severity no longer drives a discrete jump in requirements; the October 2025 proposals extended the framework, including publishing final scenarios by mid-February, and the November 2025 Federal Register rule added model and scenario transparency provisions. The stated rationale is volatility reduction in requirements — a policy judgment that smoother buffers serve capital planning better than scenario-driven jumps. The tradeoff is inherent: averaging any instrument smooths its signal, by construction.
What does averaging do to the numbers' meaning?
Exactly what averaging always does — the analysis is the same one this site applies to rolling windows. A two-year averaged requirement responds more slowly to a deterioration visible in the current year's test: a weak result is diluted by the prior year's stronger one, and the buffer adjusts halfway in year one and fully in year two, if the weakness persists. Conversely, sharp improvements phase in equally slowly. Comparability breaks across the boundary: 2026 requirements averaged under the new framework are not directly comparable with pre-averaging years, and analysts quoting a year-over-year change in aggregate capital requirements are comparing instruments, not just outcomes — the vintage problem, in regulatory form. The Fed's publications document the framework; the interpretation discipline belongs to readers.
What did the 2026 results themselves show?
Per the June 24, 2026 release: 32 banks tested, aggregate projected losses of nearly $708 billion under the severely adverse scenario, an aggregate peak-to-trough CET1 decline of 1.6 percentage points — a milder projected decline than the 2025 exercise showed for its scenario — with all banks exceeding minimum capital requirements. The scenario design matters to the read: 2026 scenarios were built on December 31, 2025 balance sheets, and scenario severity varies year to year by construction, which is precisely the variability the averaging framework is designed to absorb at the requirements level. Any cross-year comparison of loss projections inherits both scenario differences and methodology differences; the publication itself states the scenario assumptions.
How should readers track the change?
By vintage, as with any revised series: the Federal Reserve publishes the stress test methodology, scenarios and results annually — the 2026 introduction and results at federalreserve.gov — and the averaging framework's first full cycle completes when 2027 requirements blend two averaged years. Comparisons across the boundary should be labeled as such; comparisons within the new regime can begin once two averaged cycles exist. Instruments that change while measuring are the rule in regulation, not the exception — the reader's job, as ever, is to keep the vintage attached to the number.