
A PMI diffusion index measures the breadth of change reported by surveyed purchasing managers: each component is the weighted share of firms reporting improvement plus half those reporting no change, so a reading of 50 means as many firms reported deterioration as improvement, and readings above or below 50 describe how widespread — not how large — the change was. The Institute for Supply Management has published its Manufacturing PMI monthly since 1948 on this design.
PMIs are the most-watched early indicators in the world — first of the major monthly releases, TIMELY to a fault — and among the most consistently misread. The misreading is always the same: treating a diffusion number as a magnitude. A PMI is a count of hands raised, and what it says about the size of what those hands are doing is indirect and conditional.
How is the index constructed?
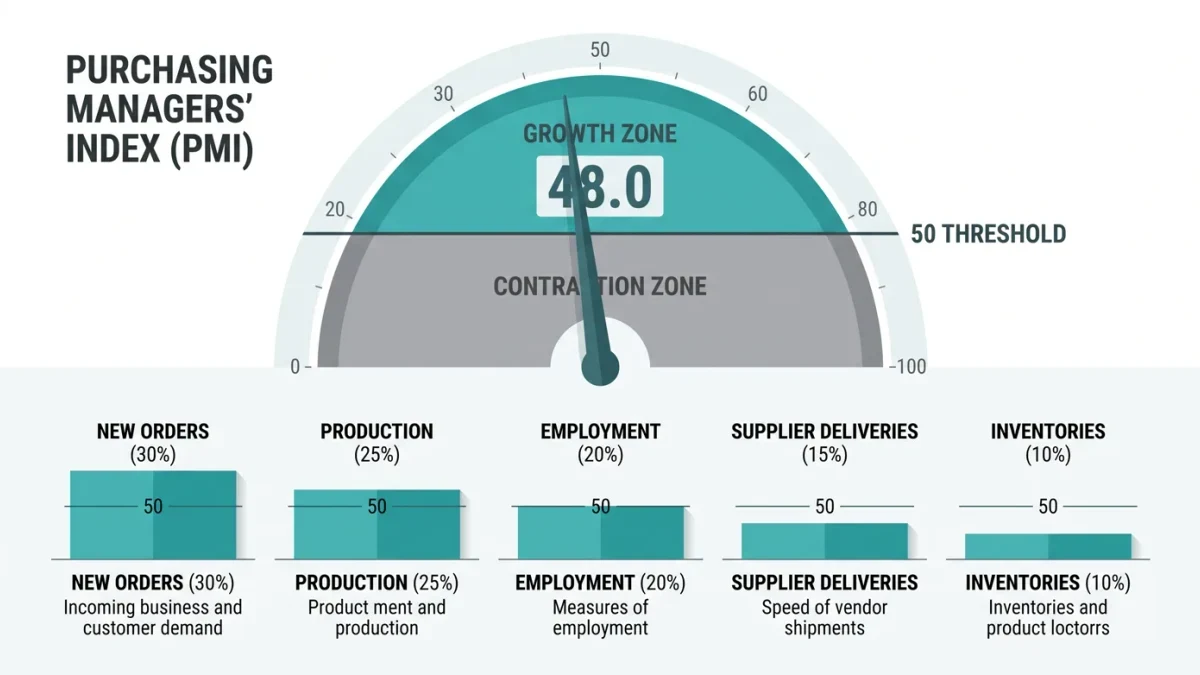
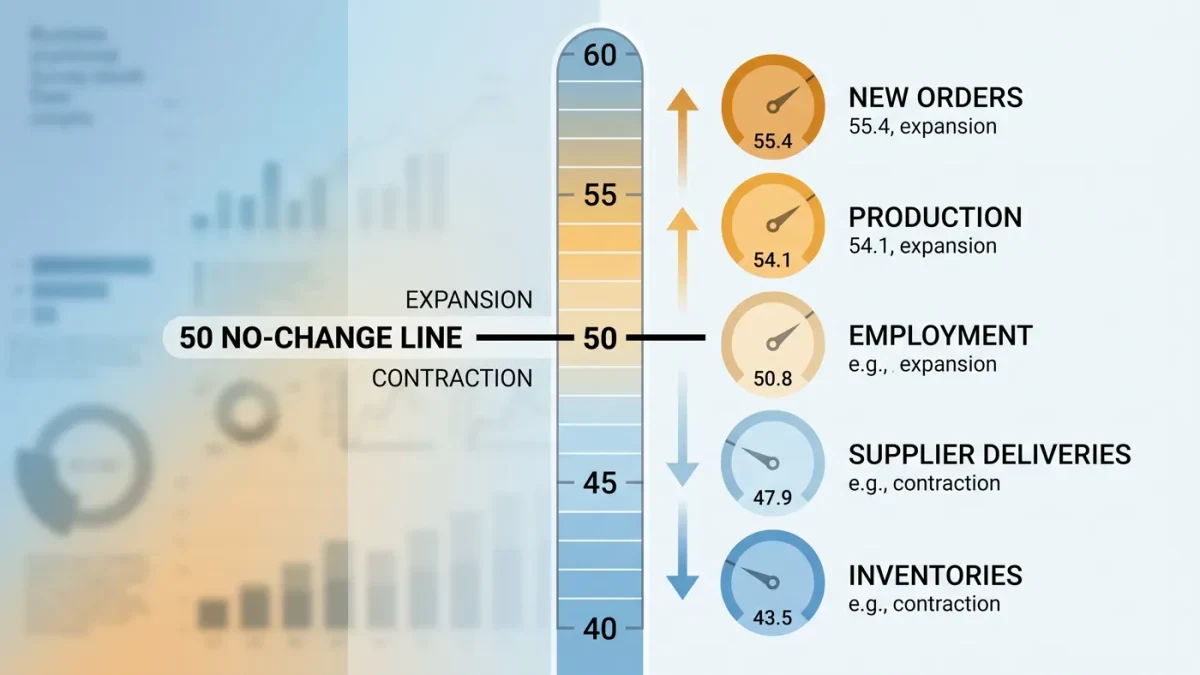
Survey respondents — purchasing managers at a stratified panel of firms — answer each component question as better, same, or worse than last month (or higher/same/lower for prices and employment). The diffusion index for a component is the percent reporting better plus half the percent reporting same. The headline Manufacturing PMI is a weighted composite of five equally standard components: new orders, production, employment, supplier deliveries (inverted, since slower deliveries typically signal demand strength), and inventories. Sub-indices for new orders and prices get their own scrutiny because orders lead and prices inform inflation reads. The composite's exact weighting has varied by publisher — ISM uses a specific blend documented in its own materials — but the diffusion principle is identical across PMI families.
What is the meaning of the 50 line?
Exactly the balance point and nothing more: equal numbers of firms improving and deteriorating. Two implications follow. First, the distance from 50 measures breadth — 55 means a solid majority improving, whether each improved by a little or a lot. Second, the change in the index measures acceleration of breadth, not level: a PMI rising from 45 to 48 describes deterioration becoming less widespread — still more firms getting worse than better. This is why "PMI rose but remains below 50" headlines are not contradictions but precise statements about a second-derivative quantity.
How do PMIs relate to GDP and other data?
Statistically, with stated conditions. ISM's own documentation and a long academic literature find Manufacturing PMI levels consistent with overall economic expansion when above roughly 42-43 over time, with 50 the manufacturing-sector balance line — the sector can sit below 50 in an economy that is still growing, as manufacturing repeatedly has, because manufacturing is a minority of GDP. PMIs correlate with subsequent official data — industrial production, GDP — with correlations that are decent but period-dependent, and the first-of-month timing is exactly why markets react: the PMI arrives before the hard data it will later be checked against. The check usually shows direction captured, magnitude approximate — a diffusion instrument doing what a diffusion instrument can.
What are the known failure modes?
Four documented. Small-sample noise: panels of a few hundred firms make monthly readings jumpy, and single-month moves near 50 are often noise — the surveys themselves publish guidance on meaningful changes. Interpretation inversion: the supplier-deliveries component is inverted, so slower deliveries raise the PMI; in supply-shock periods — 2020-2022 being the canonical run — slow deliveries reflected shortages, not demand, and the component pointed the wrong way, a distortion the post-pandemic episodes made famous. Seasonal adjustment: applied, but holidays and weather still leave residual patterns. And survey sentiment: respondents report perceptions, which correlate with, but are not, output — expectations can move a PMI before reality does.
| Reading | Breadth meaning | Common misread |
|---|---|---|
| Above 50 | More firms improving than worsening | "The sector is growing by X%" — no magnitude implied |
| Exactly 50 | Balanced breadth | "No change anywhere" — mix can be wide |
| 45 rising to 48 | Deterioration, less widespread | "Improvement" — improvement in breadth, not level |
| Below ~43 sustained | Consistent with overall recession per ISM guidance | Treating 49 as recessionary for the whole economy |
How should a reader use PMI releases?
Read the breadth, not the level, in the verbs: what share of the panel is improving. Compare like with like — ISM Manufacturing, ISM Services, and the S&P Global flash PMIs use related but distinct panels and timing, and cross-family comparisons need their documentation. Watch the components, since new orders and delivery times carry different information than the composite. The primary sources publish methods: ISM's own reports explain construction, and the Census Bureau's diffusion-based releases offer a .gov comparator in diffusion methodology at census.gov. A PMI is a fast, honest instrument with one narrow talent — counting breadth — and it stays honest exactly as long as its readers know what was counted.