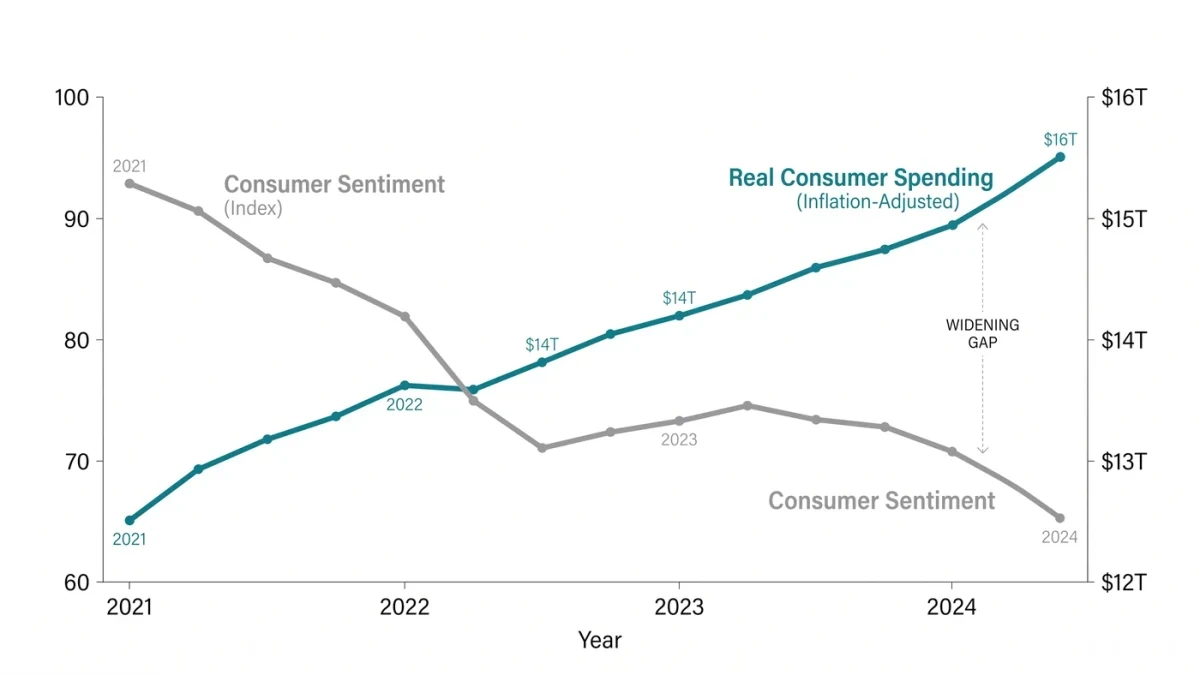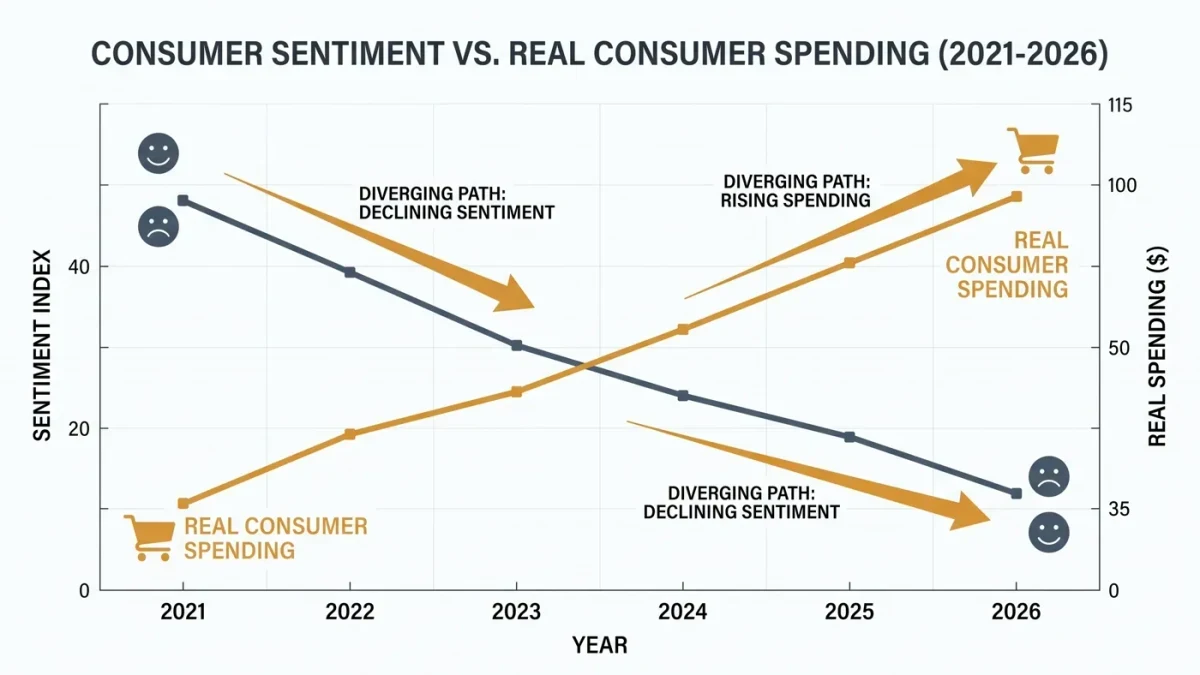
The two main U.S. consumer confidence measures — the University of Michigan's Consumer Sentiment Index and the Conference Board's Consumer Confidence Index — are built from different question sets on different monthly schedules, and their most documented behavioral fact is the weak link between what consumers say and what they do: sentiment readings diverge from actual retail sales growth for years at a stretch, including the 2022-2024 period when Michigan sentiment sat near record lows while real consumer spending kept growing.
Confidence surveys are read as if they were spending forecasts, which they are not designed to be and do not reliably function as. What they measure is stated attitudes — answers to specific questions under specific conditions — and their value lies in what the attitudes correlate with, which is a documented, conditional, and sometimes surprising list.
How are the two indexes built?
The Michigan survey, running monthly since 1978 with roots in the 1940s, asks about current personal finances and expectations — a handful of core questions on financial situation, business conditions over the next year and five years, and buying conditions for durables — aggregated into a sentiment index, with current-conditions and expectations sub-indices. The Conference Board survey, monthly since 1967 through Nielsen, asks households about business conditions, employment availability and income expectations over six and twelve months, producing the headline confidence index and an expectations component. Both are diffusion-style aggregates of qualitative answers; neither asks about dollars. The two indexes correlate imperfectly, and the differences trace to the question frames — jobs and income in the Conference Board's frame versus prices and personal finances in Michigan's — and to field timing within the month.
What do the surveys correlate with?
Documented, conditional relationships. Expectations components correlate with subsequent spending directionally but weakly — the Michigan expectations series was designed with this use in mind, and its predictive power for consumption is positive but modest, improving when combined with income and labor variables. Confidence correlates strongly with gas prices and labor market conditions — the gas-price relationship is one of the most replicated in applied consumer research, visible in the 2022 episode when sentiment collapsed as pump prices spiked and partially recovered as they fell. And political alignment effects are now documented in the survey-methodology literature: sentiment gaps between the parties' supporters shift with control of government, adding noise to the level and its interpretation.
Why does sentiment diverge from spending?
The 2022-2024 divergence is the canonical modern case: Michigan's sentiment index hit lows comparable to the worst readings in its history in mid-2022, while real personal consumption expenditures continued to grow through the same period, and the gap persisted for years. Analysts proposed durable explanations — inflation's asymmetry between price levels and rates, partisan composition effects, the gap between national statistics and personal experience — and the episode is now a standard citation for the surveys' limits as spending forecasts. The reconciliation is not mysterious: the surveys ask how people feel about conditions; spending responds to income, wealth and credit conditions, which in that period stayed supportive even as feelings did not. Attitudes and budgets are different variables.
How should the numbers be used?
As attitude measurements with three honest uses: tracking turns in expectations components around identifiable shocks; cross-checking against the hard data they allegedly predict — retail sales, personal consumption expenditures — with the divergence itself treated as information; and reading sub-indices rather than headlines, since buying-conditions answers respond to prices while employment expectations respond to the labor market. The failure modes are symmetrical: treating sentiment as a spending oracle, or dismissing it entirely when it diverges — both discard the instrument's actual, documented content.
| Feature | Michigan Sentiment | Conference Board Confidence |
|---|---|---|
| Since | 1978 (roots 1940s) | 1967 |
| Question frame | Personal finances, prices, buying conditions | Business conditions, jobs, income expectations |
| Known strong correlate | Gas prices, inflation expectations | Labor market conditions |
| Sub-indices | Current conditions; expectations | Present situation; expectations |
What about the inflation-expectations questions?
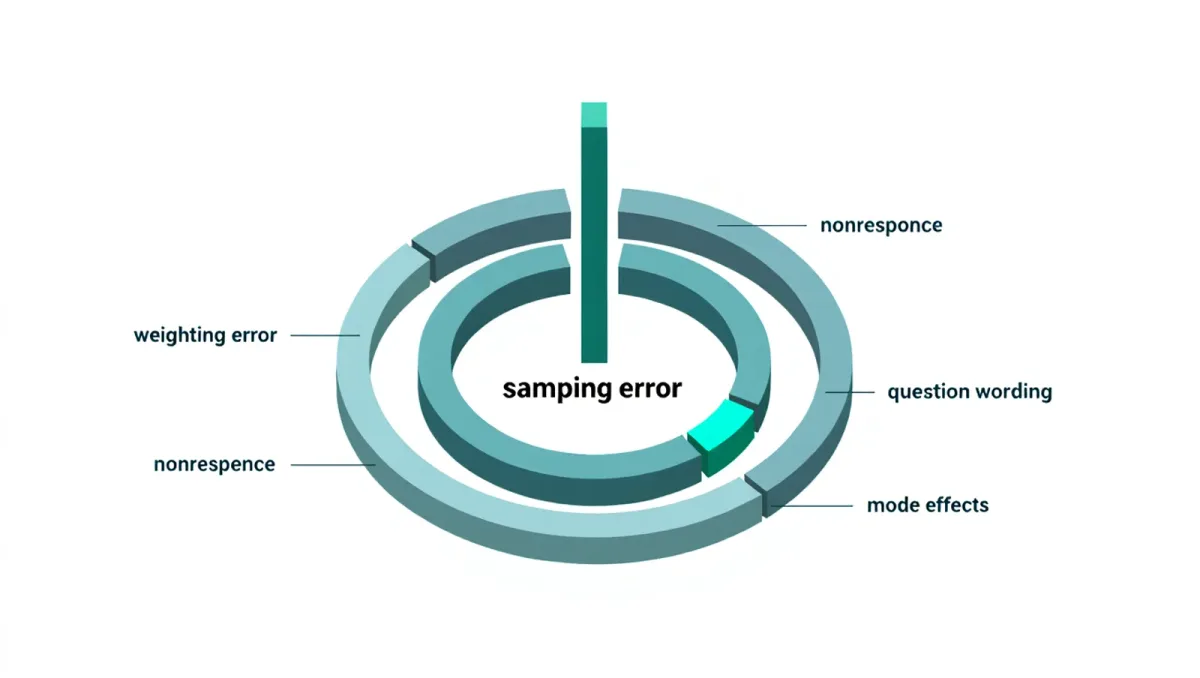
Michigan's survey carries a second, policy-relevant output: median expectations for inflation over the next year and over the next five to ten years. These series are watched by the Federal Reserve — longer-horizon expectations feed into assessments of whether inflation expectations remain anchored — and they carry their own documented measurement issues: median responses cluster at round numbers, a tail of high responses moves the mean, and experimental variations in question wording change the answers measurably. The survey research center publishes the medians with the distribution detail needed to read them properly, a level of self-documentation that makes the series more useful than most sentiment offshoots — and the same discipline of reading what was asked applies.
What is the primary documentation?
The survey sponsors publish methodology and question wording — Michigan through its survey research center, the Conference Board through its technical notes — and the hard-data comparators are freely available: retail sales from the Census Bureau and personal consumption expenditures from the Bureau of Economic Analysis, whose data and release schedules are at census.gov and bea.gov. The honest summary for readers: confidence surveys are good instruments for exactly what they ask — feelings about conditions — and the disciplined use is checking what those feelings actually tracked, which the public record answers.