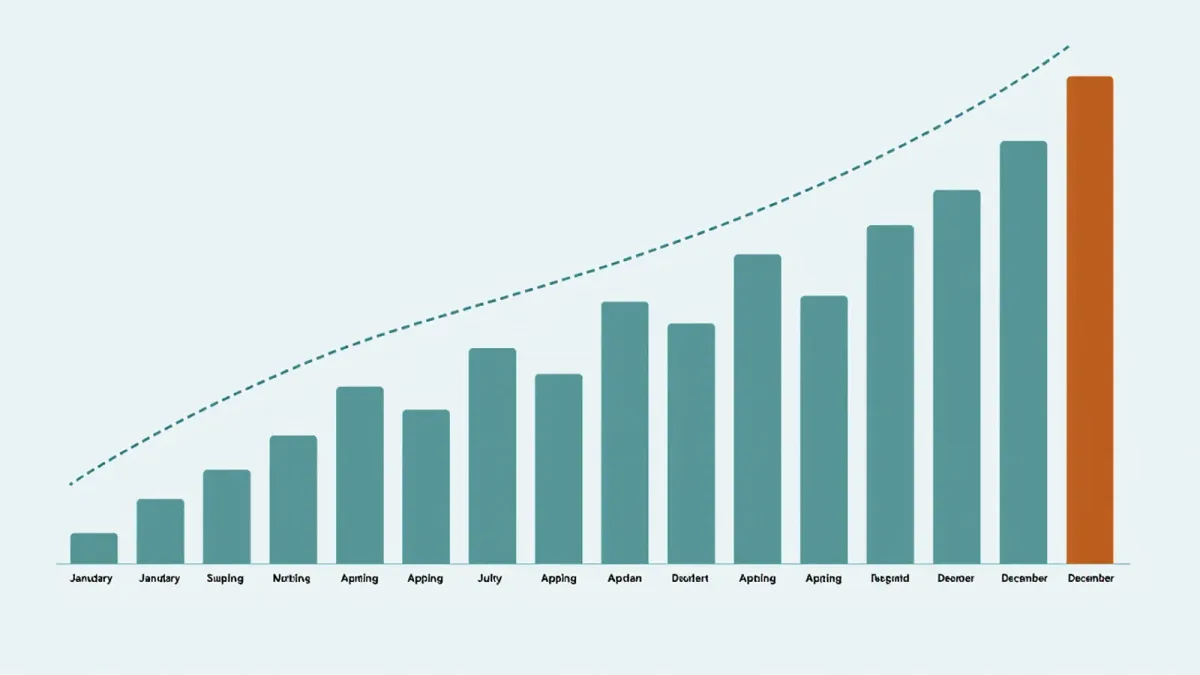

Government economic statistics are revised by design: the first payroll print is an estimate from a partially responded sample, revised twice as responses complete, then annually benchmarked against unemployment-insurance tax records covering nearly all payroll employment — and seasonal adjustment itself is re-estimated each year, with the new factors applied to up to five years of history, so the same underlying data produces different published numbers as the filters update.
"The data was wrong" is the usual reading of a revision. The more accurate reading is that the statistical agencies publish estimates with published schedules for becoming less wrong, and the error properties of each release are documented in technical notes the agencies themselves write. Revisions are not failures of the system; they are the system, and knowing the schedule changes how any given print should be read.
What are the revision stages?
For the employment report, the canonical example: the first estimate drops on the first Friday after the reference week, based on whatever portion of the establishment survey panel has responded by then; over the next two months, late responses arrive and the figure is revised twice; once a year, the benchmark process reconciles the entire year against UI tax records — a near-census — correcting any drift in the sample-based estimates. The CPI revises only seasonally adjusted series, with seasonal factors re-estimated annually and the past five years of adjusted history restated, while the index levels themselves are not revised. GDP, at the Bureau of Economic Analysis, moves through the vintages: advance, second and third estimates within the quarter, annual updates and comprehensive benchmark revisions that can restate years of history when methodology or source data change.
How does seasonal adjustment generate revisions?
Seasonal adjustment estimates what a series would look like without its recurring seasonal pattern — holidays, school calendars, weather — by estimating that pattern from recent history and subtracting it. The estimate is re-done annually, because the pattern itself drifts: shopping seasons shift, weather normals move, policy calendars change. When the new factors are computed, the past is restated with them. Two documented pathologies deserve attention. Residual seasonality: adjusted series can retain seasonal patterns the filter missed — the literature has documented this for quarterly GDP growth, where first-quarter growth ran persistently weak in adjusted data for years before methodological corrections. Pandemic-era distortion: the 2020 collapse and rebound broke the seasonal estimation machinery, and the agencies published analyses of the distortions — the Cleveland Fed and others documented how the unprecedented swings contaminated the filters, a case study in what happens when the past stops predicting the pattern.
How big are revisions, typically?
Documented and published. For payrolls, the average absolute revision to the first estimate over recent decades runs in the tens of thousands of jobs, against monthly moves quoted in the low hundreds of thousands — material for month-to-month narrative, smaller for trend. For GDP growth, average revisions between the advance and latest estimates run a few tenths of a percentage point, with occasional episodes far larger at turning points, when sampling responds slowest to genuine breaks. The agencies publish these error distributions themselves — the BLS and BEA technical documentation includes revision statistics by series — which makes revision size one of the best-documented uncertainties in public statistics.
| Series | First estimate basis | Revisions | Annual anchor |
|---|---|---|---|
| Nonfarm payrolls | Partial sample response | Two monthly revisions | UI tax records benchmark |
| CPI (adjusted series) | Full month sample | Seasonal restatement only | Five-year factor re-estimation |
| GDP growth | Advance, partial source data | Second, third estimates | Annual + comprehensive updates |
What did the 2025-2026 shutdown episode show?
The partial government shutdown that began affecting statistical operations around late 2025 provided a live stress test of the machinery's dependence on collection: the February 2026 Employment Situation release — the December 2025 data — was delayed beyond its scheduled February 6 date because collection and processing were disrupted, as widely reported at the time, and the agencies published notes on which series were affected and how. The episode belongs in this article because it displayed the system's honesty at scale: rather than printing numbers of unknown quality, the schedule itself moved, and the documentation of the gaps became part of the record. Data gaps are a revision story told in advance.
How should a reader treat a fresh print?
With the vintage named. An advance GDP estimate and a post-benchmark series are different objects; a first payroll print and the same month after benchmarking differ by design. Practical discipline: quote the vintage, weight trend over level, and treat single-month or single-quarter first prints as provisional by construction. The schedules and revision statistics are primary documents — the BLS technical notes and the BEA revision histories, with calendar and methodology at bea.gov and bls.gov. The first print is an estimate of an estimate; the revision schedule is the number's honesty, printed in advance.