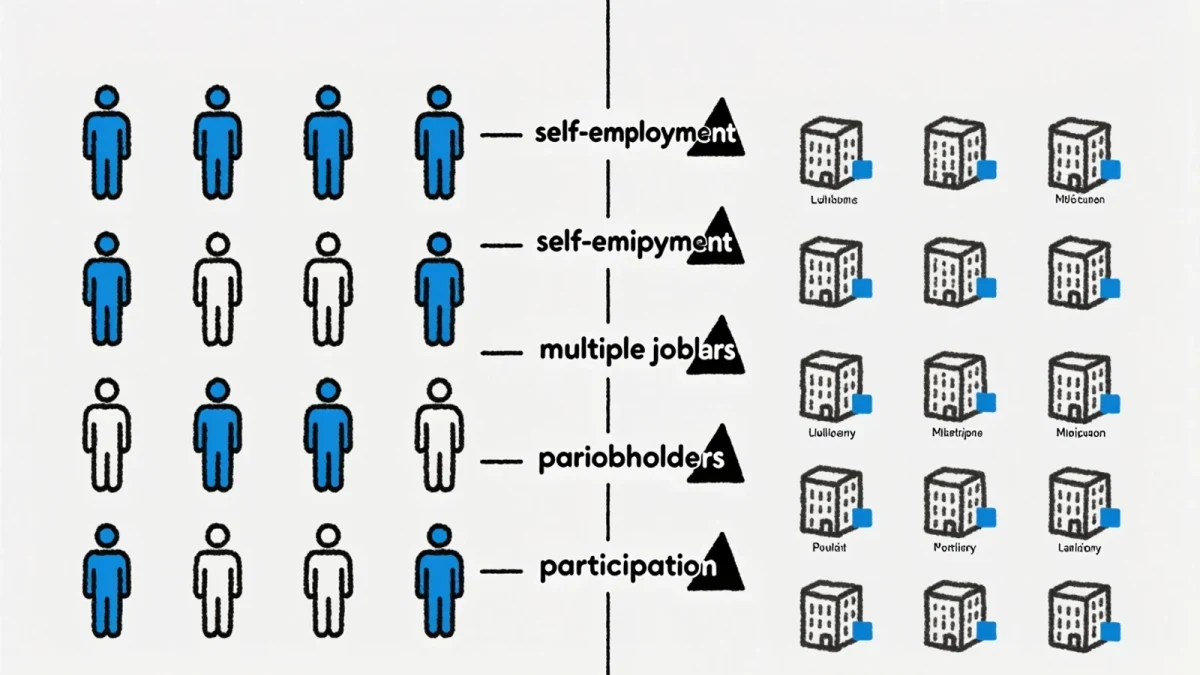
The unemployment rate and the payroll count come from two different surveys — the household survey, which measures people, and the establishment survey, which measures jobs — and they diverge regularly for mechanical reasons: the household survey counts the self-employed, agricultural workers and unpaid family labor that establishments miss, while the establishment survey counts multiple jobholders once per job, so in months when employment grows through self-employment or second jobs, payrolls can rise while the unemployment rate fails to fall.
Every month the Employment Situation release prints both numbers side by side, and every few months they disagree enough to make headlines. The disagreement is not noise to be averaged away; it is information about what kind of employment changed. The two surveys are designed differently, sampled differently and revised differently, and their known biases explain most of the divergence before anyone reaches for economic interpretation.
What does each survey actually measure?
The household survey — the Current Population Survey, jointly with the Census Bureau — interviews roughly 60,000 households monthly and classifies people: employed, unemployed (without work, actively seeking, available), or out of the labor force. The unemployment rate is the unemployed share of the labor force, which is employment plus unemployment. The establishment survey — the Current Employment Statistics program — surveys about 119,000 businesses and government agencies about their payrolls: how many positions were on the books, hours and pay. The payroll number in the headlines is a net change in nonfarm payroll employment from this survey.
Why do they diverge mechanically?
Five documented wedges. Coverage: households capture farm workers, the self-employed, unpaid family workers, private household employees and workers on unpaid leave; establishments do not. Multiple jobholders: each job counts in payrolls, one person in the household frame. Boundary: a striking gig worker counts as self-employed at home, possibly not in payrolls at all. Denominator effects: the unemployment rate moves with labor-force participation — people entering joblessness from outside the labor force raise the rate without any payroll change, and discouraged workers leaving the force lower it. And sampling error: both surveys are samples, with published standard errors — roughly 100,000-plus on monthly payroll change at 90 percent confidence in recent BLS documentation — meaning a "strong" 150,000 print and a "weak" 50,000 print can be statistically close cousins.
What are the revision regimes?
The two surveys revise differently, and the asymmetry matters for reading the economy in real time. Payrolls: monthly preliminary estimates are revised twice, then annually benchmarked against unemployment-insurance tax records — a near-census of covered employment — which corrects accumulated drift; benchmark revisions have occasionally rewritten a year's hiring story by hundreds of thousands of jobs, the 2019 benchmark process being a public example. The household survey: benchmarked to population controls from the Census, with the annual update, and it is the source of the labor-force participation rate, which payrolls cannot provide. In data-gap episodes the machinery shows through: during the fall 2025 shutdown period, collection and processing disruptions affected both programs, and the BLS documented the impact in its release notes — a live demonstration that the instruments, not just the economy, can move the print.
| Feature | Household survey (CPS) | Establishment survey (CES) |
|---|---|---|
| Unit measured | People | Jobs (payroll positions) |
| Sample size | ~60,000 households | ~119,000 establishments |
| Captures self-employment | Yes | No |
| Multiple jobholders | Counted once | Counted per job |
| Anchor revision | Population controls (Census) | UI tax records benchmark |
| Headline output | Unemployment rate, participation | Nonfarm payroll change |
Which number answers which question?
Labor utilization: the household frame — unemployment, participation, employment-population ratio — because it measures people's relationship to work, including the margins payrolls cannot see. Business activity and cyclical momentum: payrolls — establishment employment is tightly tied to output and earnings, and its benchmark anchor makes its trend durable. Labor-market slack at the margin: both, jointly — a falling unemployment rate with flat participation and weak payrolls tells a different story than the same rate with rising participation, which absorbs jobless workers without counting them unemployed. No single number summarizes the release; the monthly document prints the whole instrument panel, and the BLS publishes its methods and standard errors at bls.gov.
Where do jobs-report readings mislead?
Three recurring slips. Reading month-over-month noise as trend without the published standard errors attached. Choosing the friendlier of the two surveys per month — a discipline failure this site would flag in any other context: state which instrument you use and why, consistently. And ignoring the denominators: the unemployment rate can fall for good reasons (employment up) or bad ones (participation down) — the composition is a published line away. The Employment Situation is one of the best-documented statistical products in the world; reading it well is mostly a matter of respecting its design.