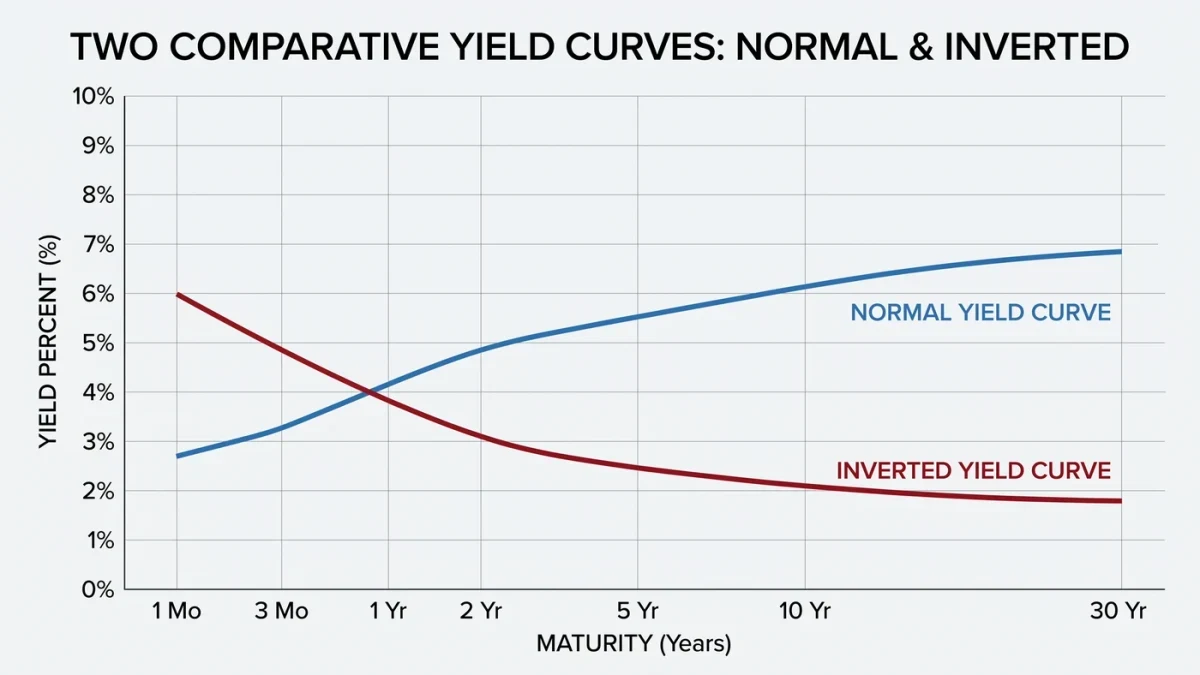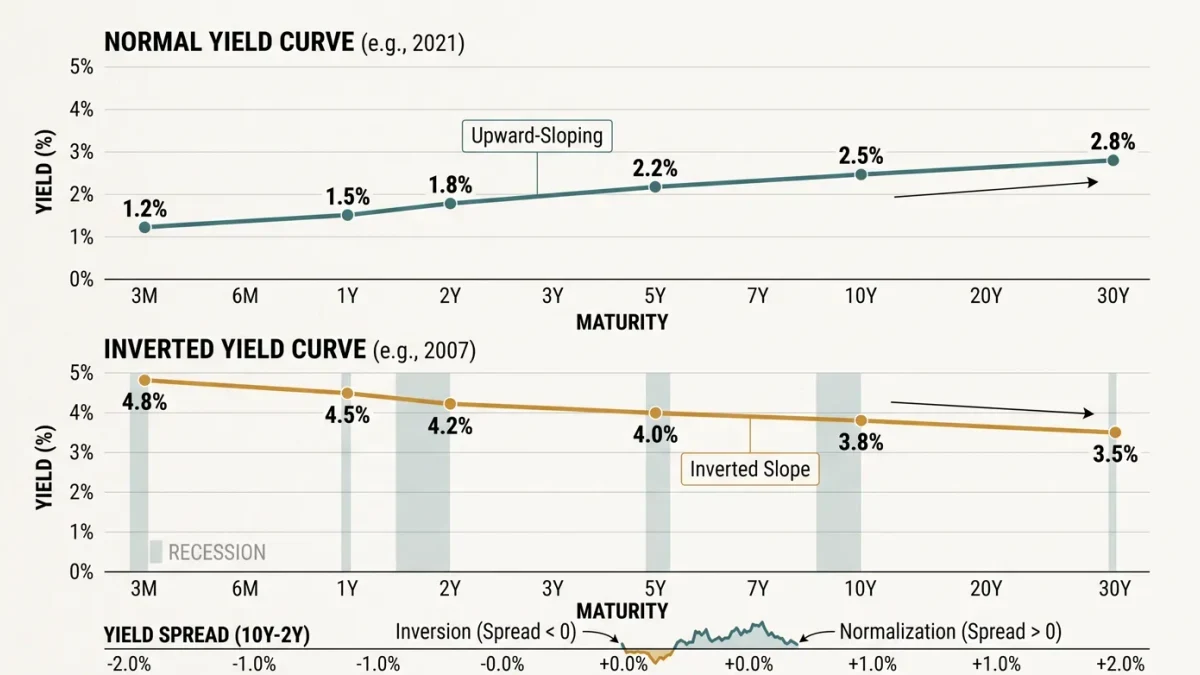

A yield curve inversion — short-term Treasury yields rising above long-term yields — has preceded every U.S. recession since the early 1970s when measured by the 10-year minus 3-month spread, with lags ranging from several months to more than two years, according to the NY Fed's published recession-probability model documentation built on Estrella-Mishkin research.
The yield curve is the most argued-about recession indicator in finance — invoked as oracular by one camp and dismissed as broken by another, often in the same quarter. Its actual standing is more disciplined than either camp: a long, well-documented conditional regularity with known lags, known failure modes, and a known mechanism debate. Those specifics are the article.
What is being measured?
The spread between two Treasury yields of different maturities — most commonly 10-year minus 3-month, or 10-year minus 2-year. A positive spread (the normal state) pays lenders more for longer commitments; an inversion reverses that. The data are public: Treasury constant-maturity yields from the Treasury Department and the Federal Reserve's H.15 release, maintained daily. Which spread matters operationally: the 10y-3m is the academic standard because it has the longest clean history and the strongest published statistical record in the Estrella-Mishkin tradition; the 10y-2y is the media standard; they disagree at the margins — one can invert while the other has not.
What is the documented track record?
Inversions of the 10y-3m spread preceded the U.S. recessions of the early 1980s, 1990-91, 2001, 2007-09 and 2020 — the last with the shortest lag, muddied by the pandemic shock — and the model based on the spread, the Estrella-Mishkin probit, has published probability thresholds that flagged each. The costs of the signal are equally documented: lags that vary from about six months to over two years, making the signal useless for timing; and false positives abroad or at the margin — inverted curves in other economies that did not deliver recessions on the U.S. pattern, and near-inversions that resolved without consequence. A signal with a two-year variable lag is a statement about conditional frequency, not a calendar.
Why would the curve invert — and why might it predict?
The mechanism debate is live. One channel: inversions typically follow monetary tightening — short rates rise with policy while long rates respond less if markets expect growth and inflation to fall — so the inversion is a summary of what the bond market prices about the policy cycle. Another channel: bank profitability — banks borrow short and lend long, and compressed or negative margins can tighten credit supply, transmitting the signal into the economy. Both channels are studied with supporting and complicating evidence; what is fair to say is that the curve compresses a great deal of macroeconomic pricing into one number, which is why it outperforms most single indicators in the probit literature while remaining silent on mechanism.
Why did the 2022-2024 episode test the signal?
The post-pandemic inversion was historically deep and historically long — the 10y-3m spread inverted in October 2022 and stayed inverted into 2024, one of the longest inversions on record — and the debate that followed was a live test of the false-positive question. As of the relevant period, the U.S. had not entered a formally dated recession during the inversion itself, and commentary split between "broken signal" and "long lag, wait" camps. A measurement publication records both that the inversion occurred and that the sample was still open — along with the mechanical facts that gross interest income on short Treasuries during the episode made the carry environment unusual, and that the Fed's own staff probability model published elevated recession probabilities through the period. The episode is a reminder that indicator evaluation is done on complete cycles, not mid-stream.
| Episode | 10y-3m inversion | Recession onset | Lag |
|---|---|---|---|
| Early 1980s cycles | 1980; 1981 | 1980; 1981 | Months |
| 1990-91 | 1989 | July 1990 | ~1 year |
| 2001 | 2000 | March 2001 | ~1 year |
| 2007-09 | 2006 | December 2007 | ~2 years |
| 2020 | 2019 | February 2020 | ~6 months (pandemic-muddied) |
| 2022-2024 | Oct 2022 onward | Sample contested | Debate ongoing in period |
Does the record hold outside the United States?
Less cleanly, and the qualification matters. Studies of other advanced economies find inversion-recession links that are weaker and less uniform — some countries show the predictive pattern, others have inverted without recessions and recessed without inversions, and structural differences in banking systems, sovereign debt loads and monetary regimes are the standard explanations offered. The strong track record is a U.S. result on U.S. data with roughly a half-dozen clean episodes — a sample small enough that every caution about small-sample inference applies. Treating the U.S. record as a universal law of yield curves is the kind of generalization that fails exactly once and then gets argued about for a decade.
How should a reader use the indicator?
With its conditions attached: name the spread, note the depth and duration of the inversion, treat the lag distribution as wide, and treat any probability figure as a model output with a stated sample — the NY Fed's model page publishes the probabilities with methods. The primary data are at home.treasury.gov daily yield curves and the Federal Reserve's H.15. The honest summary: the curve is a conditional regularity with the best documented record among simple indicators, and no timing content whatsoever. Anyone quoting it as a countdown is selling a precision the data never contained.