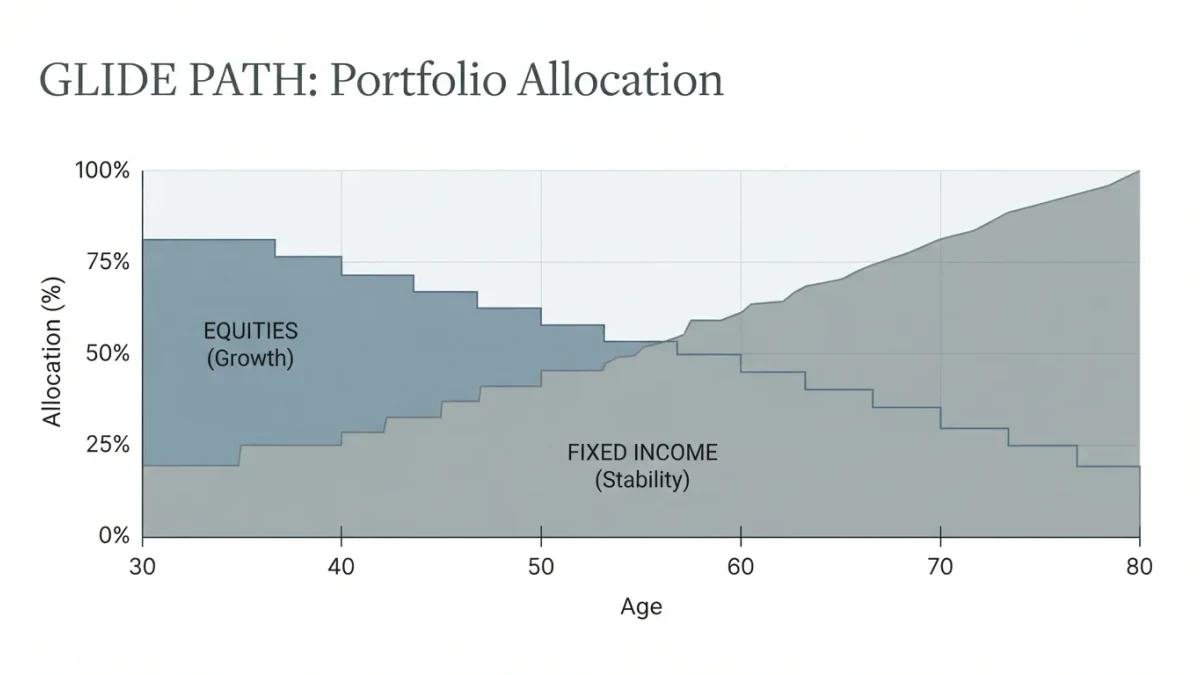

Sequence-of-returns risk is the dependence of a withdrawal portfolio's survival on the order of returns rather than their average: a portfolio experiencing its worst years in the first decade of withdrawals can be exhausted by losses that the same average, arriving later, would have left survivable — the canonical illustration being the retiree starting withdrawals in 1973-74 or 2000-02 versus the identical-average path with the bad years at the end.
The effect is counterintuitive precisely because accumulation arithmetic trains the opposite intuition: while saving, only the average matters, since no cash leaves and every year compounds the same base. Once withdrawals begin, the multiplication order stops commuting. Sequence risk is the name for that broken commutativity, and it is a mathematical property, not a market forecast.
Why does order start to matter when withdrawals begin?
Because withdrawals lock in losses. A 30 percent decline in year one of retirement removes dollars that would have compounded for decades, and the withdrawal taken the same year sells shares at the bottom to fund spending. The same 30 percent decline in year twenty-five hits a portfolio that has already funded most of its plan. The average of the two paths is identical; their terminal wealth is not. The technical statement: terminal wealth under withdrawals is a path-dependent product of gross-return factors each applied to a base already reduced by prior spending, so the multiplication order changes the result.
How is the effect demonstrated?
By permutation studies: take an actual historical return series, hold the set of annual returns fixed, and reorder them across a 30-year withdrawal period. Studies of this kind show terminal outcomes ranging from comfortable survival to early exhaustion across permutations of the same average — a spread far larger than the difference between investing skill levels. The same demonstration explains why historical retirement studies anchor on start years: a 1966 retiree faced a sequence that devastated withdrawals despite subsequent average returns that look acceptable on paper; a 1982 retiree faced the reverse. Bengen's original 4-percent research in 1994 and the Trinity study that followed were, at bottom, studies of historical sequences — every safe-withdrawal number ever quoted is a statement about the particular sequences in the sample used.
What is the relationship to the 4 percent rule?
The rule is a sequence-risk summary with a sample attached. Bengen's 4 percent figure was the highest initial withdrawal that survived every historical 30-year sequence in U.S. data from 1926 to 1992, subsequently extended; the Trinity study tabulated outcomes across asset mixes and inflation adjustments on similar samples. Two caveats travel with any such figure. First, sample dependence: conclusions rest on U.S. historical sequences, and sequences outside the sample — lower returns, higher correlation between bad returns and inflation — are not represented. Second, definition dependence: adjusting withdrawals, using different periods or asset mixes, or taxing the account changes the number, which is why published variants range materially above and below 4 percent. A withdrawal rate is a hypothesis tested against sequences; it is not a property of markets.
What measurably reduces sequence exposure?
Mechanisms documented in the literature, each a trade rather than a free lunch: cash or bond buffers that fund early withdrawals without selling equities in drawdowns — reducing forced selling at the cost of holding lower-return assets; dynamic withdrawal rules that cut spending after losses, converting market risk into consumption risk; and liability-matching floors built from annuities or Treasury ladders, which remove sequence exposure entirely for the covered spending at the cost of liquidity and, for annuities, credit and inflation terms. Equity glidepaths that start conservative and rise through retirement — the rising-equity glidepath research published in 2013 — showed improved outcomes in simulations relative to static mixes in many sequences, precisely because early-year equity exposure is the danger zone.
| Mechanism | Reduces sequence risk by | Cost |
|---|---|---|
| Cash/bond buffer | Avoiding forced equity sales in drawdowns | Lower expected return on buffer assets |
| Dynamic withdrawals | Cutting spending after losses | Consumption volatility |
| Annuity / T-bond floor | Removing exposure for covered spending | Liquidity, credit and inflation terms |
| Rising equity glidepath | Lower early-retirement equity share | Forgone upside if early years are good |
Where does sequence-risk talk mislead?
Three slips recur. First, quoting a safe-withdrawal rate without its sample and rules — the number is a sequence summary, not a constant of nature. Second, treating average-return assumptions as sufficient for retirement planning: two plans with identical averages and different early-year paths are different plans, and Monte Carlo tools that report only average outcomes hide the variable that matters. Third, promising sequence protection from diversification alone: within-equity correlations rise in bad sequences, as the diversification literature shows, so the protection must come from the spending and structure side, not solely from the asset side.
Readers can verify the mechanism directly: any retirement calculator that reports outcome distributions across simulated sequences — rather than a single average path — displays sequence risk as the spread of the distribution. The Securities and Exchange Commission's materials at investor.gov cover withdrawal-rate basics; the underlying studies — Bengen 1994, the Trinity study, the glidepath research — are published with their samples and methods, and repay reading in the original.