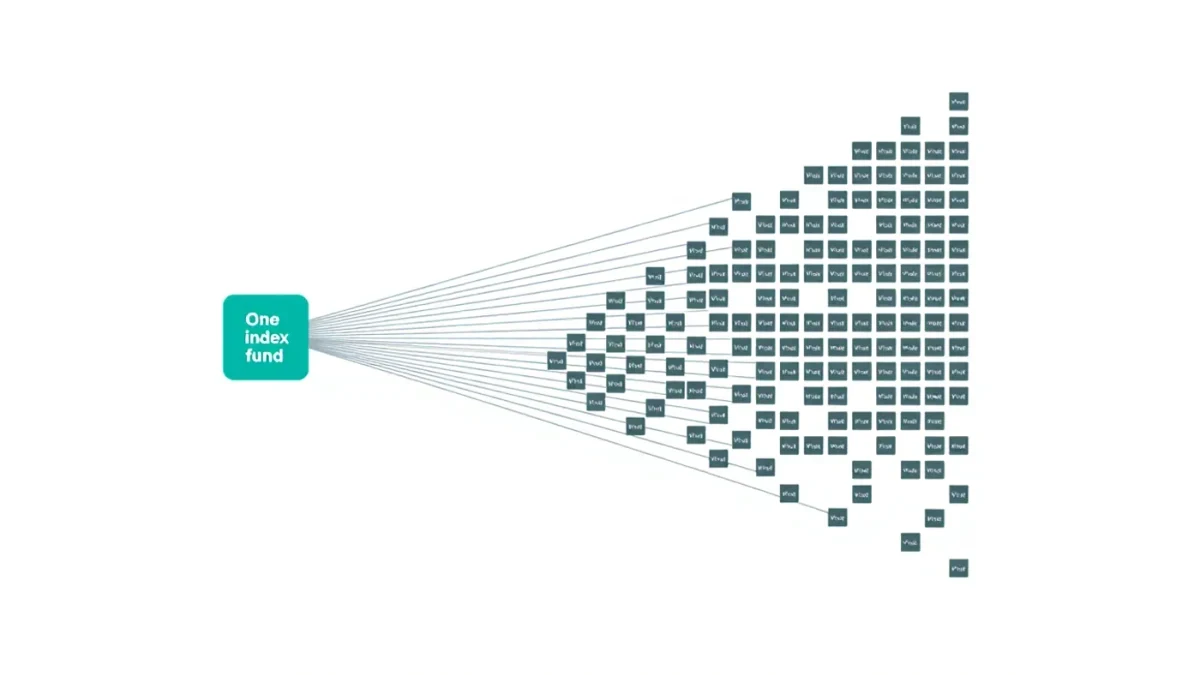

An index fund returns less than its benchmark by fees plus replication frictions, and the measured gap — tracking difference — decomposes into four parts: the expense ratio, the costs of buying and selling index changes, sampling error when the fund holds a subset of the index, and timing differences between when the fund and the index account for dividends. Large index funds tracking broad U.S. equity benchmarks have published tracking differences clustering in the low single-digit basis points above their fees in recent years.
"My fund beat the index" is usually a benchmark mismatch wearing a victory ribbon. The first question is always which index, with dividends or without, total-return or price-only. After that, the residual gap has a short, checkable list of causes — and each of them appears in fund disclosures if you know where to look.
What is the difference between tracking difference and tracking error?
Tracking difference is the arithmetic gap between fund return and index return over a period — a number in basis points. Tracking error is the standard deviation of those gaps through time — a volatility of divergence, not a level. A fund can have near-zero tracking error and a steady negative tracking difference: it lags by exactly its costs, reliably, every month. That pattern is in fact the signature of a well-run index vehicle, and the two numbers answer different questions: how much did I lag, and how unpredictable was the lag.
What causes the gap?
Five mechanisms, in rough order of reliability. Fees, the largest and most reliable, subtract the expense ratio every year. Transaction costs from index reconstitution — additions, deletions, rebalances, corporate actions — are paid by the fund but not modeled by the index, whose changes are costless on paper. Sampling: for indexes with thousands of securities or illiquid segments, funds often hold a representative subset plus derivatives overlays, and the subset's returns diverge slightly from the whole. Dividend timing: indexes credit reinvested income on schedule; funds receive, hold and reinvest cash with lags measured in days. Securities lending: funds lend holdings and earn income the index never has, which can push tracking difference the other way — funds occasionally beat their benchmarks by lending, a fact disclosed in fund reports.
Why do ETFs and mutual funds track differently?
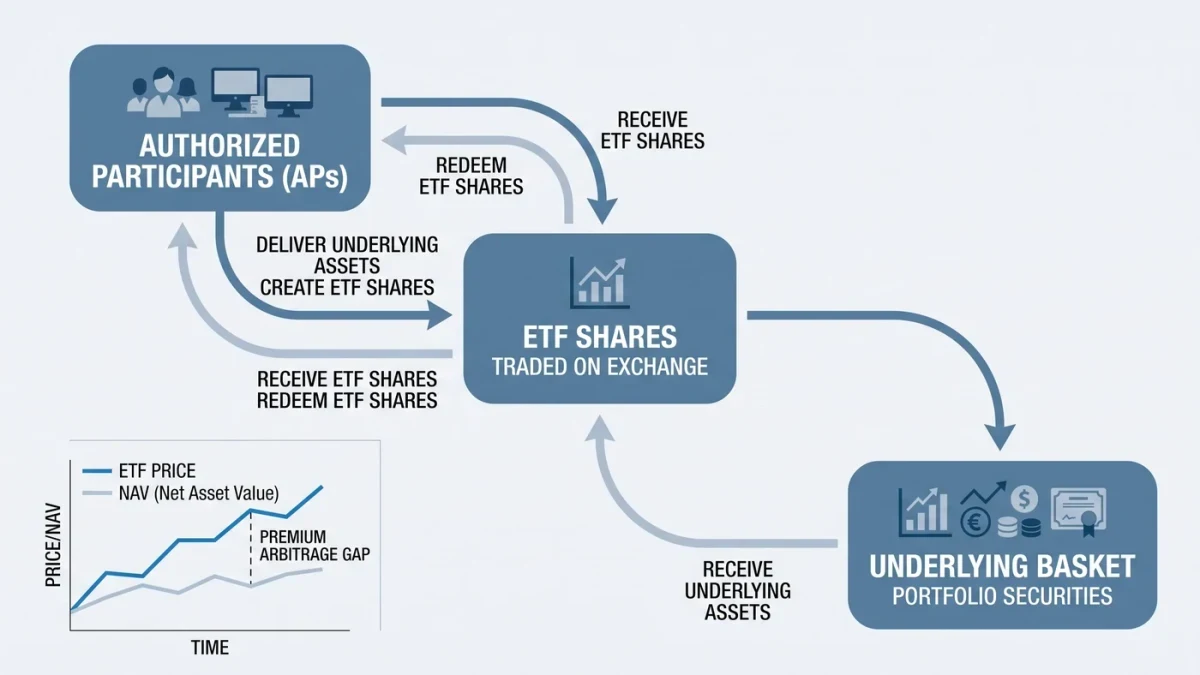
Structure adds channels. Mutual funds hold a cash buffer for redemptions, which in rising markets is a small drag and in falling markets a small help. ETFs minimize cash through the creation-redemption mechanism — authorized participants deliver baskets — which is the standard explanation for ETF tracking differences often running tighter than mutual fund peers. ETFs also trade at market prices that can deviate from their intraday net asset value; that premium-discount noise does not change the fund's NAV-based tracking but does change what an investor actually receives if buying and selling at market. Both structures report their own tracking statistics in annual and semiannual reports, in a standardized table.
How big are the gaps in practice?
For broad-market, highly liquid indexes — the S&P 500 and total-market families — large funds' reported tracking differences cluster within a few basis points of their expense ratios, with lending income sometimes offsetting costs nearly fully. The gaps widen mechanically with index difficulty: international and emerging-market funds carry wider frictions from time zones, withholding taxes and liquidity; bond index funds wrestle with thousands of off-the-run issues and their sampling; narrow sector and single-country funds inherit the reconstitution costs of concentrated benchmarks. Fund documents state each fund's own figures — the range across products is wide enough that the disclosure is worth reading rather than assuming.
| Source of gap | Direction | Predictable? | Where disclosed |
|---|---|---|---|
| Expense ratio | Drag | Yes, exactly | Fact sheet, prospectus |
| Reconstitution trading costs | Drag | Roughly, per index family | Annual report |
| Sampling / optimization | Either | Noisy | Prospectus strategy section |
| Dividend timing | Small drag | Mostly | Annual report |
| Securities lending | Gain | Variable | Annual report, lending note |
How should a reader check a fund's tracking?
Three steps, all from public documents. Pull the fund's stated benchmark and its tracking table from the latest shareholder report — funds are required to show returns against benchmark for one-, five- and ten-year periods. Compare tracking difference over five and ten years rather than one: single years are noisy with reconstitution events. Then compare the fund's gap with its expense ratio: a gap persistently and materially above fees is a question worth asking of the manager — sampling drag, cost overruns or tax effects are the usual answers. The Securities and Exchange Commission requires the disclosures; the investor-education desk at investor.gov explains how to read a fund's fee and performance tables.
Where does tracking talk mislead?
Three recurring slips: comparing a fund against a price-only index when it reports against total return — the dividend gap alone can exceed all real frictions; quoting tracking error (a volatility) as if it were tracking difference (a level); and ignoring premium-discount for ETFs when discussing investor experience. Each error inflates or erases real differences by construction. The correct posture is boring and exact: name the fund, the index, the period, and the two statistics, separately.