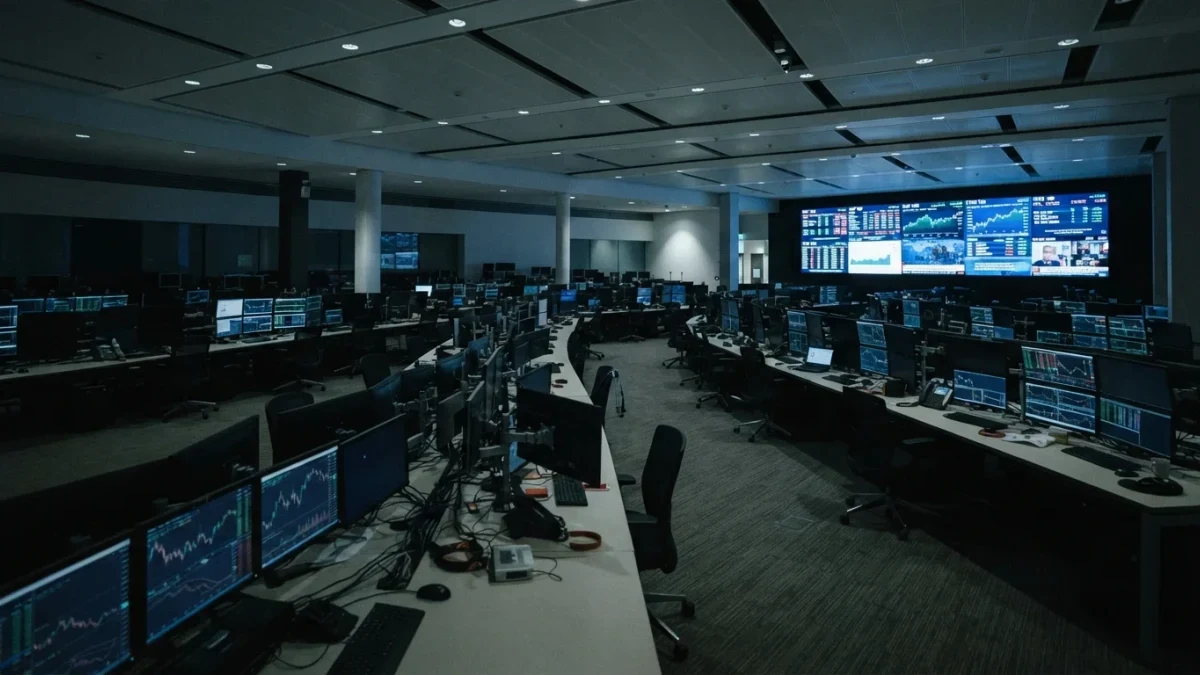

Trading volume counts shares or contracts changing hands in a period, and on modern equity tape it includes mechanically generated flow — index rebalancing, volatility-target strategies, options hedging and market-making inventory — that carries no view on direction. A documented illustration: S&P 500 rebalance days produce closing-auction volume many multiples of a normal session for the same stocks, purely from funds copying an index.
"Heavy volume confirms the move" is one of the oldest formulas in market commentary, and it fails as stated: volume confirms only that transactions occurred, not why, nor in whose interest. The modern volume series is a mixture whose composition has shifted for two decades, and reading its level without its composition is reading a total as if it were an average.
What is in the volume number?
Every print on the consolidated tape: buys from sellers at agreed prices, whoever the parties are and whatever their motives. The mixture includes directional traders, hedgers adjusting derivative books, market makers turning inventory, index funds executing creations and rebalances, and volatility-control strategies mechanically scaling exposure up and down as measured volatility moves. Two of those five categories — hedging and rule-based rebalancing — generate volume on schedules that are public knowledge, which is why volume spikes are predictable on quad witching expirations and rebalance Fridays without any news at all.
Equity volume also concentrates heavily in the closing auction in the modern market: a large fraction of daily volume in S&P 500 names prints in the final minutes, a structural shift documented in exchange market-quality statistics over the past fifteen years. A "daily volume" figure for such names is, to a first approximation, mostly one auction.
What is volume genuinely good for?
Three uses have solid standing. First, execution planning: liquidity estimates for order sizing are built from volume distributions by time of day; this is volume as capacity, its least ambiguous role. Second, event verification: whether a price move happened on unusual participation — an abnormally high or low count relative to trailing norms — is a checkable fact, whatever it means. Third, microstructure diagnostics: volume-validated price moves feed realized-volatility estimators, where volume weights improve the noise properties of the statistic. In all three uses, volume is compared against its own trailing distribution for that security and time of day — never read as a raw level.
What doesn't volume tell you?
It does not reveal direction of conviction. Volume is symmetric in buyers and sellers — every trade has both — so a high-volume decline and a high-volume advance are equally "confirmed" by the count. It does not measure participation breadth: one institution sweeping the book and a million retail orders can print the same shares. It does not distinguish informed from uninformed flow, despite a large academic literature attempting to infer exactly that from volume-signed-by-price patterns; those inferences are statistical, sample-dependent and far from individual-trade truth. And it does not validate price levels: assets have made durable lows on quiet volume and ephemeral ones on record volume.
Why has the composition shifted?
Three structural forces, each measurable in public data. Indexing grew, and index products trade on index schedules. Options volumes grew faster than equity volumes for over a decade, and every options hedge is an equity print somewhere. Systematic volatility strategies — risk parity, volatility targeting, trend followers — rebalance on measured-risk schedules rather than judgment. The result is a volume series whose rule-driven share has risen steadily, documented in academic decompositions of equity turnover across the 2010s and 2020s. None of this makes volume useless; it makes naive readings of volume increasingly misleading, because the null hypothesis "this volume reflects conviction" got weaker every year.
How should a reader treat a volume claim?
Ask four questions. Relative to what: the claim should compare to the security's own trailing distribution, not a round number. Which window: auction volume and continuous-session volume are different objects. What event calendar is nearby: expirations, rebalances and index events generate predictable spikes that carry no information. And what would falsify it: if the same commentator would have read low volume as confirming the opposite move, the claim is unfalsifiable and worth discounting entirely.
| Volume use | Standing | Key condition |
|---|---|---|
| Order-sizing capacity | Solid | Compare to time-of-day distribution |
| Event participation check | Solid as fact | Trailing norms for the same security |
| Volatility estimator input | Solid, technical | Estimator-appropriate weighting |
| Conviction confirmation | Unsupported as stated | Volume is symmetric in buyers and sellers |
For primary documentation of auction concentration and tape composition, the exchanges' market-quality reports and the Securities and Exchange Commission's market-structure filings at sec.gov publish the underlying statistics. Volume is a count. Respecting what a count can say is the entry fee for using it.