Liquidity is measured along four distinct dimensions: the quoted spread, the depth standing behind the quotes, the price impact of a given order size, and the speed of execution — and a market can be liquid on one measure and thin on another. A one-cent spread on a $100 stock looks free, but it is 10 basis points round trip before a single share moves the price, and the cost multiplies with size once the visible depth is consumed.
Unlike volatility, liquidity has no single index-level number. Every liquidity figure in circulation is a proxy answering one of several narrower questions, and the disagreement between proxies is itself information. This article walks through the standard measures, what each one captures, and where each one breaks.
What does the bid-ask spread measure?
The quoted spread is the difference between the best displayed ask and the best displayed bid, usually expressed in dollars or in basis points of price. It measures the immediate cost of a small round trip: buy at the ask, sell at the bid, and the spread is what the market structure takes from you. The effective spread refines this by comparing the trade price to the midpoint prevailing at execution, capturing cases where orders execute inside the quoted spread.
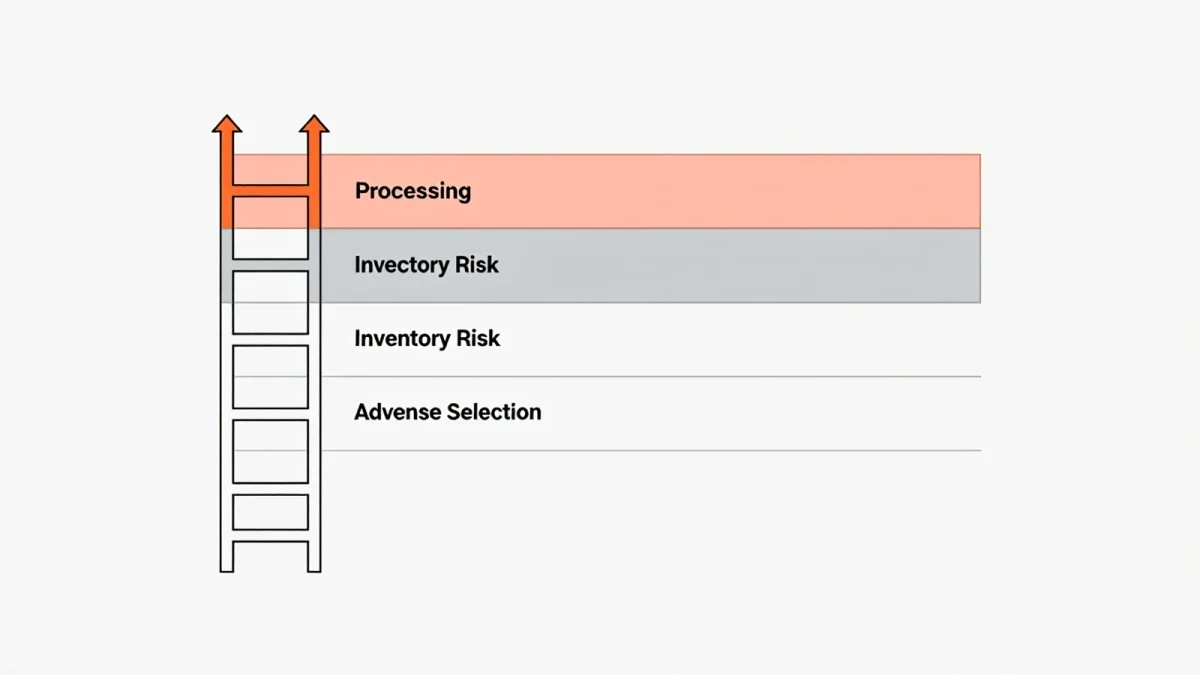
The spread is the cleanest measure for small orders in displayed limit-order markets, and the least informative for large ones. A wide spread signals either high adverse-selection risk for market makers, low competition, or high inventory risk. Which of the three is operating cannot be read from the spread alone.
What is market depth, and how is it quoted?
Depth is the volume available at or near the best prices — the number of shares executable at the ask before the price rises, and at the bid before it falls. Displayed depth lives in the limit order book; hidden and reserve orders do not, which is the measure's first structural weakness. quoted depth at any instant describes what is visible, not what is obtainable, since large orders routinely work through iceberg orders and splitting across venues.
A practical second measure is the depth at a fixed price offset: how many shares trade before the price moves, say, five or ten basis points from the midpoint. Market-quality reports by exchanges and regulators increasingly quote depth this way, because best-quote depth collapses toward zero in fast markets and makes comparisons meaningless.
How does price impact get measured?
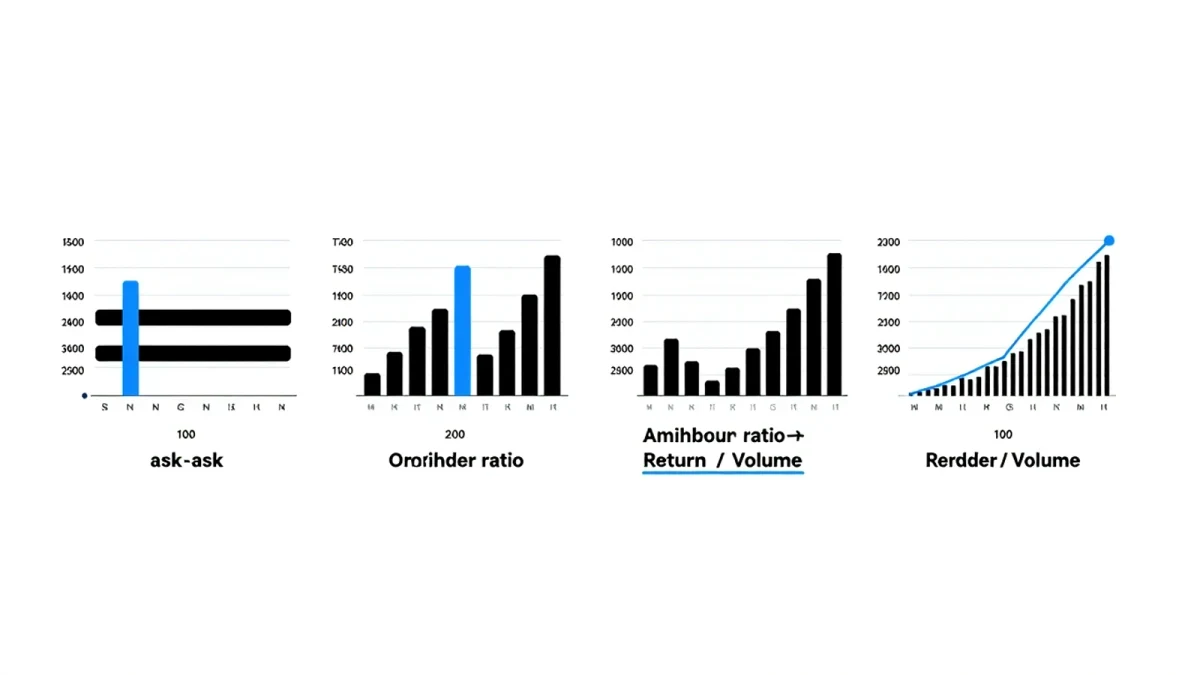
Price impact measures connect order size to price movement. The oldest still in wide use is the Amihud illiquidity measure, introduced by Yakov Amihud in 2002: the average of daily absolute return divided by dollar volume, scaled by a constant. A stock that moves a lot on little dollar volume scores as illiquid; the measure requires nothing beyond prices and volumes, which is exactly why it became standard for research across thousands of securities and decades of history.
The structural measure from the 1985 Kyle framework estimates a lambda coefficient — dollars of price movement per unit of net order flow — from trade-by-trade data. Lambda answers a question the spread cannot touch: what happens when size arrives. Its weakness is data demand and fragility: estimating Kyle lambda requires signed order flow, and the estimate moves with the choice of signing algorithm.
How do the measures disagree in practice?
Systematically. Spreads in large-cap U.S. equities have narrowed dramatically since decimalization in 2001, while depth at the top of book has become shallower over the same period, and impact costs for institutional-size orders have not fallen proportionally. A market can report excellent narrow-spread liquidity while absorbing large orders poorly. Conversely, in stressed sessions, spreads widen first and visibly, while impact measures only register in the data days later, once volumes and returns are tallied. The U.S. Securities and Exchange Commission publishes market-structure filings and research at sec.gov for readers who want primary documentation.
| Measure | Question it answers | Data needed | Known failure |
|---|---|---|---|
| Quoted / effective spread | Cost of a small immediate round trip | Quotes, trades | Says nothing about size |
| Displayed depth | Volume at current prices | Order book | Ignores hidden liquidity |
| Amihud illiquidity | Price movement per dollar of volume | Daily prices, volumes | Noisy at daily frequency |
| Kyle lambda | Impact of net order flow | Signed trades | Sensitive to signing method |
Where do all these measures fail together?
Three shared blind spots deserve emphasis. First, all four measures are computed from executed or displayed data, so they describe conditions for orders that were actually placed; they cannot price the trading that never happened because participants walked away. Second, each is regime-dependent: measured liquidity in calm markets says little about liquidity in stressed ones, when correlations rise, quote updates accelerate and depth withdraws precisely when it is most needed — the pattern documented in episodes such as March 2020 across Treasury and equity markets. Third, cross-venue fragmentation means no single book reflects the whole market; aggregates overstate what any one venue offers.
Any liquidity number quoted without its measure, market and date is close to meaningless. Readers comparing liquidity claims — from an exchange, a broker, or a research note — should ask which of the four dimensions was measured, over what window, and whether the figure refers to displayed conditions or realized executions.
What should a liquidity report state?
At minimum: the measure used, the sample window, the venue or consolidated basis, and whether the figures are time-weighted, volume-weighted or snapshot-based. Time-weighted quoted spreads overweight quiet periods; volume-weighted effective spreads overweight the busiest hours. Neither is wrong, but they answer different questions, and reports that omit the weighting convention leave that choice invisible.
Liquidity measurement is a solved problem only at the level of definitions. At the level of conclusions — is this market healthier than that one, is liquidity better than a year ago — it remains an exercise in stating conditions, which is precisely what separates a measurement from a marketing claim.