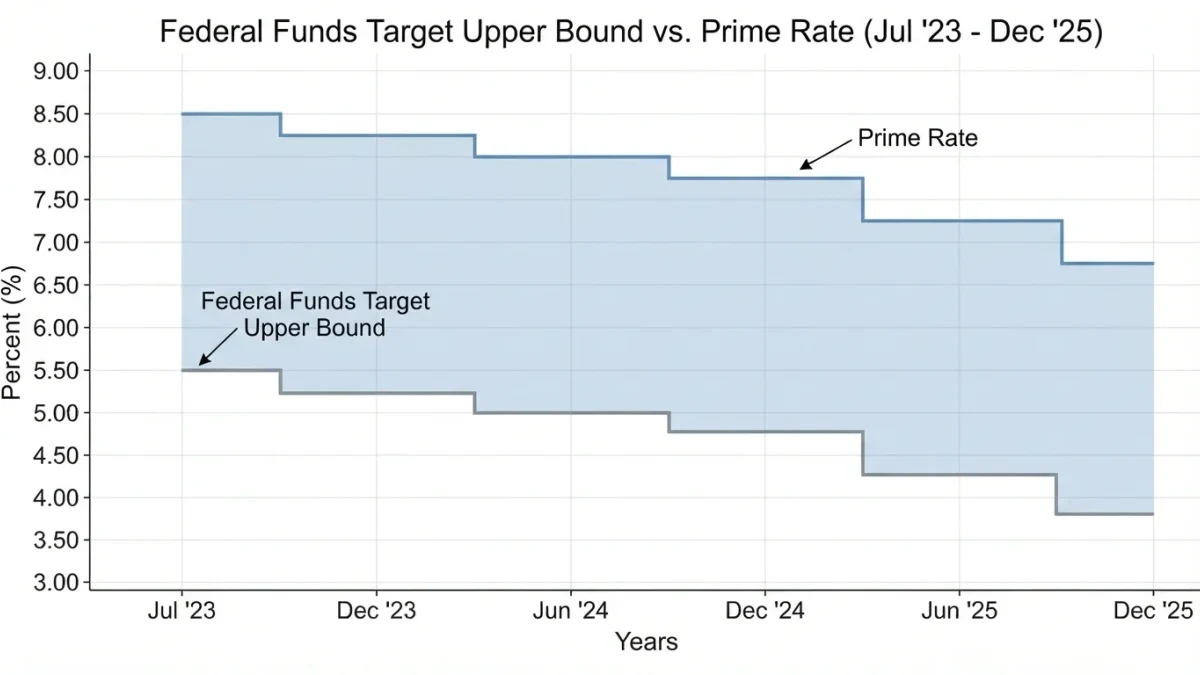

Market-implied probabilities of Federal Reserve rate decisions are computed from Fed funds futures prices by comparing each contract's implied rate with the current effective fed funds rate under an assumed average rate on non-meeting days — the standard construction dates to the Chicago Mercantile Exchange's published methodology and the Chicago Board of Trade's original contract design — and a one-quarter-point expected cut priced with certainty corresponds to a 25-basis-point gap between the implied and current rate.
Every FOMC meeting day, financial media quote odds like "an 80 percent chance of a cut." Few stories say where the number comes from. It is not a poll of economists or a prediction market's crowd; it is an arithmetic transformation of futures prices under assumptions, and the assumptions — not the arithmetic — carry the epistemic weight.
What is the underlying instrument?
Thirty-day Fed funds futures, listed at CME, settle to the average effective fed funds rate over a calendar month. Because the effective rate tracks the Fed's target range almost exactly between meetings, a futures price implies the market's average expected rate for that month. A meeting mid-month splits the month into before and after segments: the month's average implied rate mixes the pre-meeting rate over the days before the meeting and the post-meeting expected rate over the days after. That mixture is where the probability comes out.
How does a price become a probability?
Step by step. Take the current effective funds rate. Assume it holds on every day of the month except after the meeting — this fixed-rate assumption, historically anchored to the average of the recent past, is the method's central convenience. Read the futures-implied average rate for the meeting month. The implied gap versus the assumed path reflects expected policy change: a gap of 12.5 basis points around a mid-month meeting corresponds to a 50 percent probability of a 25-basis-point move, a gap of 20 points to 80 percent, a full 25 to certainty. Provincial mechanics vary by meeting position in the month, by the meeting's day count weighting, and by how far out the contract sits — but the logic is constant: price gap divided by move size equals probability, under the assumptions.
What do the assumptions cost?
Three documented distortions. Term premium and risk pricing: futures prices embed compensation for bearing rate risk, not pure expectation — researchers have estimated the bias in implied probabilities from risk premia, which typically steepen the implied path toward cuts; the Chicago Fed published analyses of this bias. The fixed-rate assumption: on days when the market itself prices intra-meeting drift — reserve conditions, quarter-end pressures — the assumed constant injects error. And microstructure: futures liquidity is thinnest at long horizons, where quoted probabilities carry wider pricing noise. The CME's own methodology documentation and the Chicago Fed studies state these limits — the probabilities are best read at short horizons, where the assumptions bite least.
How did 2026 meetings illustrate the mechanics?
The 2026 calendar supplied clean examples. At the January 27-28 meeting the Committee held the target range at 3.50 to 3.75 percent with two dissents favoring a cut, per the Federal Reserve's published statement; at the March 17-18 meeting, one member dissented the same direction; at the April 28-29 meeting four members dissented, three of them against retaining an easing-bias formulation; the June 16-17 meeting passed 12-0 in the new shortened statement format; and the July 28-29 meeting passed 9-3 with all three dissents favoring a hike, according to the statements on the Federal Reserve's site. Implied probabilities ahead of each meeting moved with incoming data as the arithmetic predicts — and the wide dissent patterns through spring 2026 kept the front-month probability curves more volatile than the policy outcomes alone, a live illustration that prices aggregate disagreement as well as expectation.
| Implied gap (mid-month meeting) | Probability of a 25 bp cut | Reading |
|---|---|---|
| 0 bp | 0% | No cut priced |
| 12.5 bp | 50% | Even odds |
| 20 bp | 80% | Strongly priced |
| 25 bp | 100% | Certainty priced |
Where do probability quotes mislead?
Four recurring slips. Quoting long-horizon probabilities as sharp numbers: at multi-meeting horizons, risk premia and thin liquidity blur the mapping — treat distant implied odds as coarse. Ignoring the fixed-rate assumption: it is a modeling convenience, not a fact. Reading certainty backward: a 95 percent implied probability that proved wrong ex post is evidence about the distribution's tail, not about the method's fraudulence. And the category error this site exists to flag: implied probabilities describe the market's pricing, which is a fact about markets — they are not forecasts the reader should act on, and this publication makes none. The primary materials are public: the CME methodology pages, the Chicago Fed risk-premium studies, and the FOMC statements and probabilities-relevant releases at federalreserve.gov.