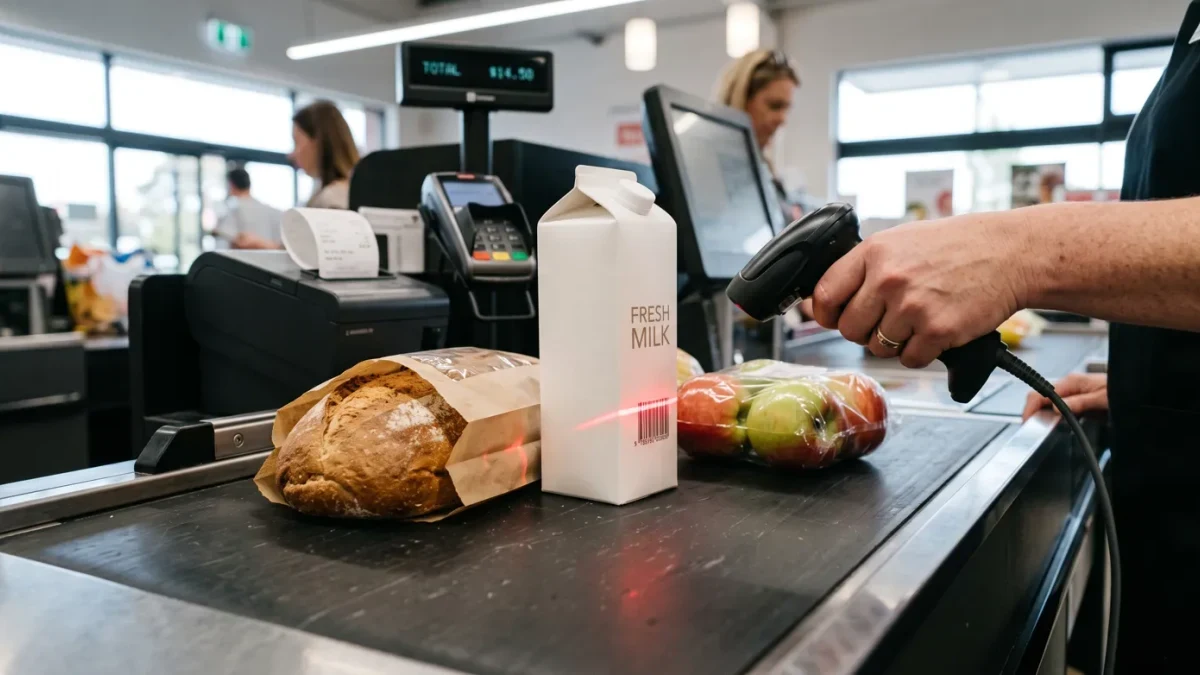

The Consumer Price Index is constructed by the Bureau of Labor Statistics from monthly price measurements of a fixed market basket of goods and services — roughly 80,000 price quotes collected monthly from about 23,000 retail and service establishments, plus rents surveyed from some 50,000 landlord and tenant interviews — weighted by spending patterns from consumer surveys, with the basket updated and corrections applied through documented procedures.
Inflation numbers move markets and politics, yet the instrument producing them is described far less often than its printouts. The CPI is a measurement with a design — sampling, weighting, and a set of judgment-laden conventions — and understanding the design explains both what the number captures and the recurring controversies around it.
What goes into the basket and its weights?
The basket and its weights come from the Consumer Expenditure Surveys — interviews and diaries in which thousands of households report actual spending. Major categories get weights from their expenditure shares: shelter is the largest single component at roughly a third of the index, with food and energy together historically around a fifth to a quarter. Weights are updated on a schedule — the BLS moved to annual weight updates in recent years, replacing the once-a-decade revisions of earlier eras — so the index reflects spending patterns with a documented lag between the survey years and their use.
How are prices actually collected?
BLS field staff and clerical collection visit or call the sampled outlets monthly, recording prices for specifically defined items — not "bread" but a defined loaf size and type — with procedures for handling product change: when an item disappears or is reformulated, collectors quality-adjust, and the adjustment methods are where much of the index's intellectual complexity lives. Housing is measured differently from purchases: owners' equivalent rent — the rent a home would command — approximates housing services for owner-occupiers, following the rental-equivalence convention used since 1983. Rents themselves enter the index with a known lag structure: new leases reset slowly into the CPI's rent sample, which is why market-rent measures lead the CPI rent component by many months — a mechanical fact central to reading inflation turning points.
What are the headline variants and why do they differ?
Several official variants answer different questions. CPI-U covers all urban consumers and is the headline figure; CPI-W covers wage earners and clerical workers and anchors some indexation. Core CPI excludes food and energy — not because they do not matter but because their month-to-month volatility is noise around the trend the core is designed to reveal, a diagnostic convention rather than a cost-of-living judgment. And the Chained CPI (C-CPI-U) applies a substitution correction: as relative prices change, consumers shift toward cheaper alternatives, and the chained variant partially incorporates that response, running on the order of 0.2 to 0.3 percentage points below CPI-U in typical years — the reason it appears in tax-bracket and benefit indexation debates, since small annual differences compound in formula.
What are the documented controversies?
The debates are old, public and quantified. Quality adjustment: how much of a price increase reflects better product — the hedonic adjustment question — entered the public arena most loudly in the 1996 Boskin Commission report, which estimated upward bias in the CPI of roughly 1.1 percentage points per year and led to methodological changes; subsequent National Research Council review endorsed some corrections and disputed magnitudes. Substitution: the fixed basket overstates inflation when consumers shift purchases, addressed partially by the chained variant. New products: prices for new goods enter late, missing early price declines. Each controversy has a literature, and the BLS publishes its methods and its responses — the disagreements are about magnitudes of corrections, not about the existence of the machinery.
| Variant | Covers / corrects | Typical relationship |
|---|---|---|
| CPI-U (headline) | All urban consumers, fixed basket with annual weight updates | The headline print |
| Core CPI | Excludes food and energy | Smoother; trend diagnostic |
| Chained CPI (C-CPI-U) | Substitution-corrected | ~0.2-0.3 pt below CPI-U typically |
| PCE price index | Broader scope, different weights (Fed's target measure) | Runs below CPI historically |
How does the CPI differ from the PCE index?
The Federal Reserve's inflation target is stated on the personal consumption expenditures price index, not the CPI, and the two differ by construction. The PCE covers a broader set of household-related spending, weights itself continuously from business surveys rather than household diaries, and updates its formula more aggressively — the net effect documented by the agencies is that PCE inflation has historically run a few tenths of a percentage point below CPI, with the gap stable enough to be a convention of its own. Housing weighs less in PCE; medical services weigh more, priced from different sources. When a Fed official cites inflation and a headline cites another, both can be correct — they are describing different instruments.
How should a reader use the release?
With the release calendar and the mechanics in mind. The BLS publishes the monthly schedule in advance, seasonally adjusted and unadjusted series, and detailed tables; reading the contribution of shelter versus other components explains most month-to-month stories, given shelter's weight and lag structure. The primary documentation — the BLS Handbook of Methods, release technical notes, and the schedule itself — is at bls.gov/cpi. The CPI is a well-documented instrument with published tolerances; the recurring public fights are about how to interpret a measurement, which is exactly the fight a measurement publication enjoys.