
The Consumer Price Index rose 3.5 percent over the 12 months ending June 2026, down from 4.2 percent in May, with the seasonally adjusted all-items increase at 0.1 percent for the month and food prices up 3.0 percent over the year, per the Bureau of Labor Statistics' June report as summarized in its TED publication.
A 0.7-point drop in the 12-month rate in a single month is a large move by CPI standards, and large moves have mechanical explanations before they have narrative ones. The discipline is always the same: decompose first, interpret second.
What moved the 12-month rate?
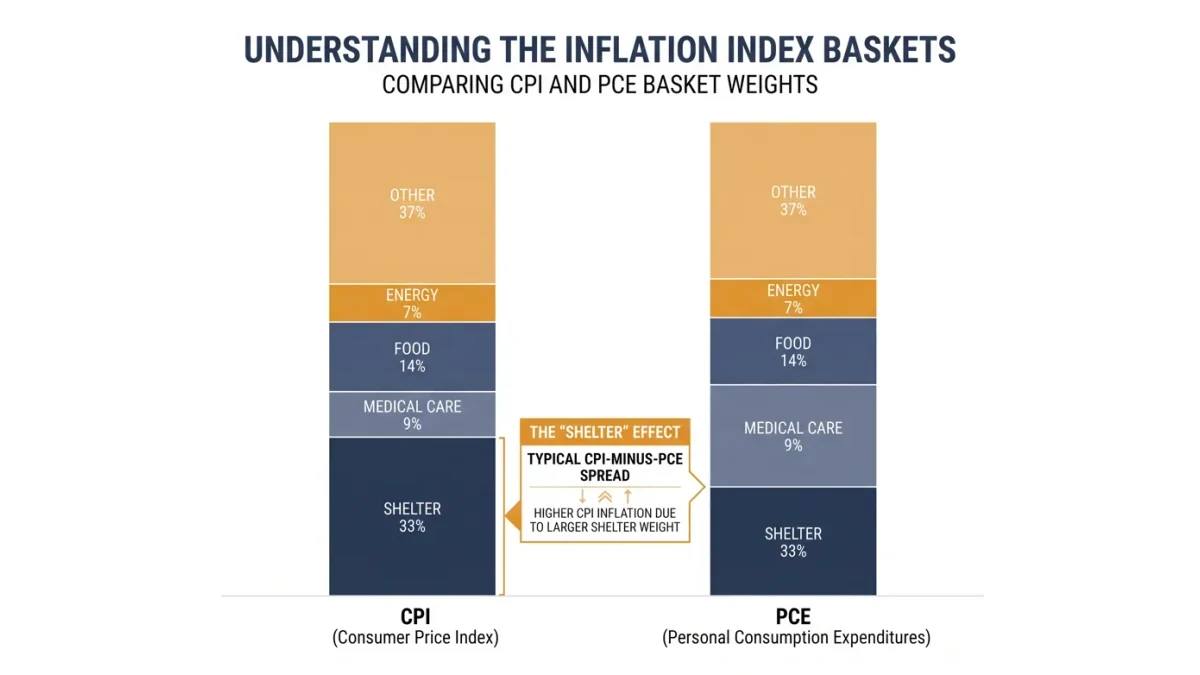
Two standard mechanisms operate in a month like June 2026. Base effects: the 12-month calculation compares this June to last June, so an unusually large increase in the index twelve months ago falls out of the window — the 2025 comparison months carry the energy-surge period, and unfavorable comparisons rolling off can move the year-over-year rate without any new monthly change. Monthly mechanics: a 0.1 percent seasonally adjusted monthly print is near-flat, and a month that follows elevated readings with near-flat prices mechanically lowers the annualized trajectory. Energy's role cuts both ways in 2026: the year's FOMC statements described inflation elevated partly on global energy prices, and any reversal in the June energy components would feed directly into the headline arithmetic. The report's component tables — energy, food at 3.0 percent year over year, shelter with its documented lag structure — attribute the movement precisely; this summary points to them rather than paraphrasing them.
What does one month not establish?
Every question the genre immediately asks: whether a trend has turned, whether policy will respond, whether inflation is returning to target. A single monthly CPI print is one observation of a noisy series whose shelter component lags market rents by many months, whose energy swings are governed abroad as much as at home, and whose seasonal adjustment is re-estimated annually. The measured facts are the 3.5 percent 12-month rate, the 0.1 percent monthly change, and the components; trend claims require the sequence of prints, read with vintages attached.
How should readers track the sequence?
By the release calendar and the primary tables: the Bureau publishes the schedule in advance, the full component detail with each release, and its TED summaries — including the June piece reading "consumer prices up 3.5 percent over the year ended June 2026" — at bls.gov. The neighboring readings — 4.2 percent for May, 3.4 percent for July — frame June inside the year's path; the August release would show the July easing continuing. The number of the month is 3.5; its meaning belongs to the sequence.