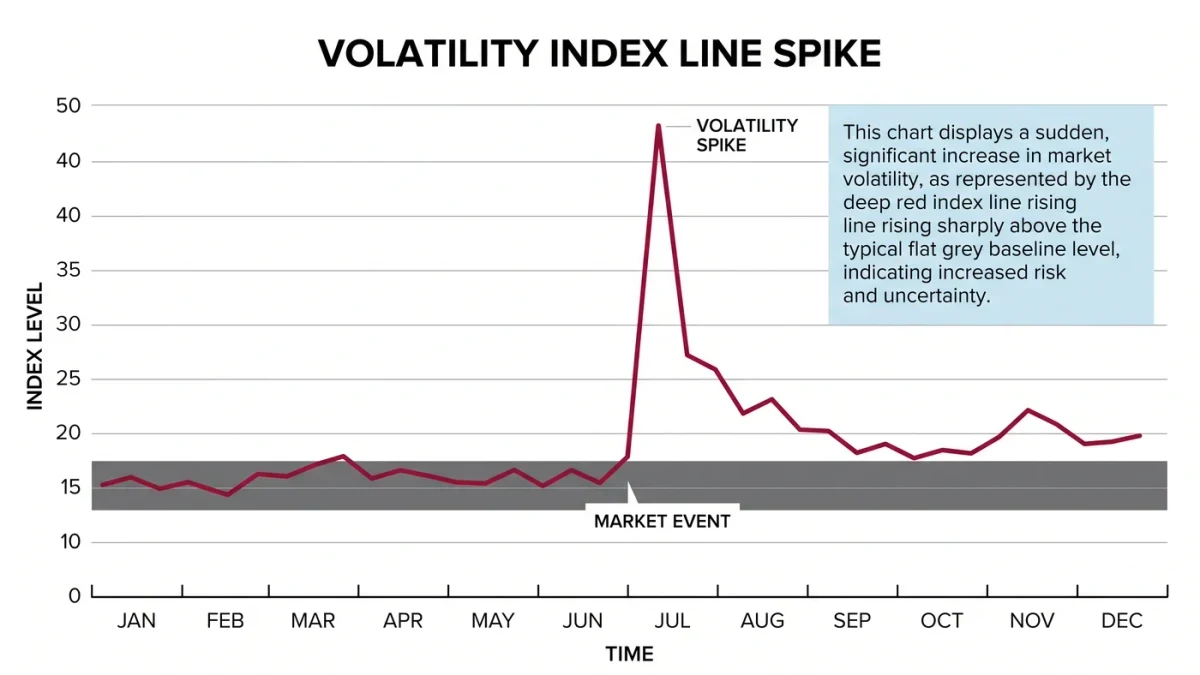

Implied volatility is the volatility level that makes an option's market price consistent with a pricing model, while realized volatility is the standard deviation of returns actually observed over a past window. On August 5, 2024, the CBOE Volatility Index traded above 60 intraday — its highest level since 2020 — yet the S&P 500's realized volatility over the following 20 trading days came in well below that reading.
The confusion between the two numbers is common because both are quoted in annualized percentage terms. But one is an output of a market price, and the other is a statistic computed from returns. Treating implied volatility as a prediction of realized volatility quietly turns a price into a forecast, which is exactly the move this site exists to examine, not to make.
What is implied volatility, exactly?
Implied volatility is the value that solves the option pricing equation backward. Given an option's market price, the strike, the time to expiry, the interest rate and the dividend assumption, there is one volatility input that reproduces the observed price. That input is implied volatility. It is a market price restated in volatility units, and it moves whenever option prices move, for whatever mixture of hedging demand, dealer inventory and news the market is processing that day.
The CBOE Volatility Index, or VIX, aggregates implied volatilities across a strip of S&P 500 options into a single 30-day reading. CBOE describes it as a measure of the market's expectation of volatility over the next 30 days. Two things are worth stressing. First, the VIX is model-dependent in its construction, built from option prices under a specific variance-strip methodology. Second, "expectation" here means the price at which volatility risk changes hands, not anyone's literal belief about the future.
What does realized volatility measure?
Realized volatility is computed, not implied. Take daily closing returns over a window — commonly 10, 20 or 30 trading days — compute their standard deviation, and annualize by multiplying by the square root of 252. The result describes what actually happened over that specific window, with no model and no forward-looking claim attached.
The measurement choices matter more than practitioners sometimes admit. A 10-day realized volatility after a quiet week and a 30-day realized volatility spanning the same week can tell visibly different stories, because the longer window averages in older, calmer sessions. Realized volatility calculated from intraday five-minute returns instead of daily closes will usually be higher, since intraday moves partially cancel out by the close. Any comparison between implied and realized numbers is only meaningful once the windows and the return sampling are matched.
Why does a gap between the two persist?
Because selling volatility is a risky business, and prices compensate for risk. Option sellers absorb large losses in exactly the states of the world when many other assets fall together, so buyers systematically pay more for volatility protection than the subsequent realized volatility turns out to be, on average. The difference is known as the variance risk premium, and it has been documented across decades of index options data in academic studies beginning with work by Carr and Wu in the late 2000s.
The premium is an average, not a law. In stress episodes — March 2020 being the canonical example — realized volatility can exceed the implied levels that prevailed before the crash, and sellers of protection lose more than the premium they collected. The premium is the compensation for those episodes, which is why it does not disappear.
How do researchers measure the variance risk premium?
The standard approach is to pair each day's implied variance — roughly the squared VIX divided by 12 for a monthly figure — with the realized variance computed over the following month, then take the difference or the ratio across a long sample. The methodological demands are strict: matching maturities, choosing a realized-variance estimator including or excluding overnight returns, and stating the evaluation window. Studies that skip these steps produce numbers that cannot be compared with the literature.
| Concept | Source of the number | Direction in time | Model-dependent? |
|---|---|---|---|
| Implied volatility | Option market prices | Forward-looking price | Yes, via pricing model |
| Realized volatility | Observed returns | Backward-looking statistic | No |
| Variance risk premium | Implied minus realized, sampled over time | Ex-post average | Only through its inputs |
Where does comparing the two mislead?
Three failure modes recur. First, horizon mismatch: comparing a 30-day implied reading against a 10-day realized window inflates the apparent premium in calm periods. Second, estimator mismatch: realized volatility computed from close-to-close returns understates total variation relative to intraday estimators, so the comparison quietly depends on the estimator choice. Third, survivorship of calm samples: the premium measured over a decade that contains no systemic crisis will look steadier than the same premium measured over a decade that contains one. Any published premium figure should state its sample period; a variance risk premium quoted without its window is not a measurement.
There is also a category error to avoid. Implied volatility can be high because demand for protection is high, not because the market "knows" turbulence is coming. The price aggregates positions and preferences as much as expectations. Reading every VIX move as a forecast confuses a market-clearing price with a prediction the reader could act on — the distinction this publication treats as foundational.
What should a reader check before using either number?
Check the window, the sampling frequency and the source convention. Confirm whether a quoted realized figure is annualized, which window it covers, and whether it uses close-to-close or intraday returns. Confirm whether an implied figure comes from a single option or an index methodology, and over what maturity. When a study reports a gap between implied and realized volatility, check that the two series were matched on horizon before anything else was concluded. The U.S. Securities and Exchange Commission's investor education materials at investor.gov cover the basics of market risk in plain language.
Matched properly, the two numbers measure something real: the price of risk transfer and the realized outcome. The gap between them is one of the most consistently documented facts in financial economics — and one of the most consistently misread.