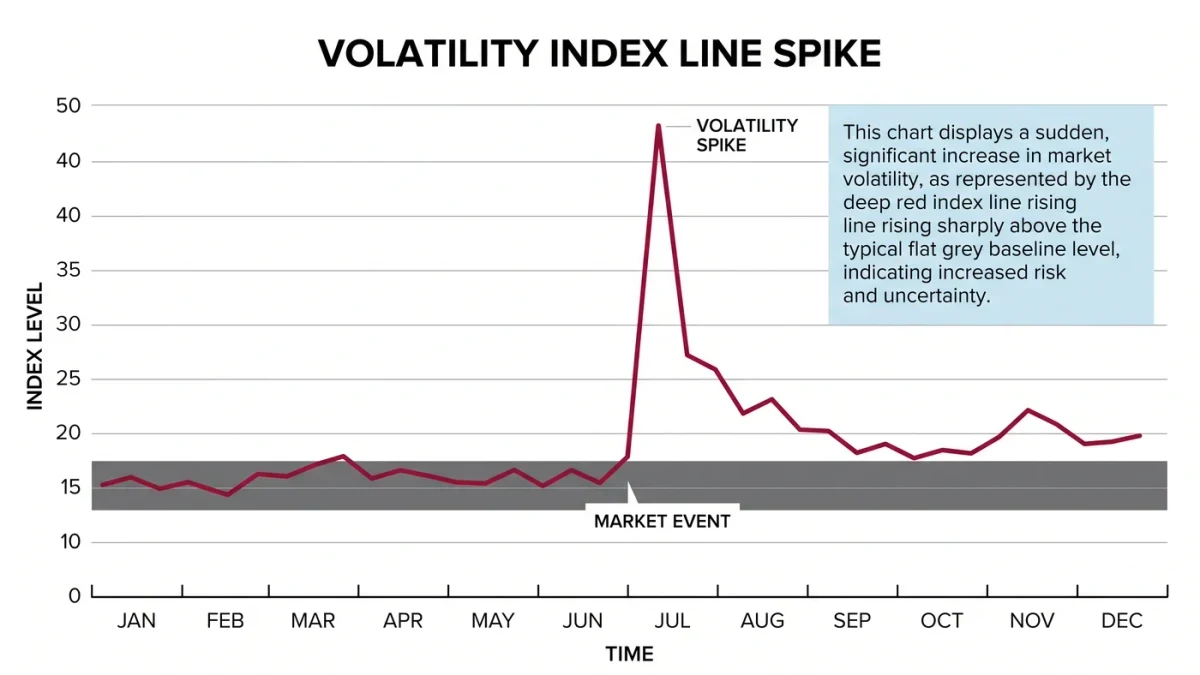

The VIX futures curve shows the prices at which standardized 30-day volatility contracts trade across expiration dates, and its two canonical shapes carry precise names: contango, when later expirations price above nearer ones, and backwardation, when they price below. In calm markets the curve sits in contango with the front months below the spot VIX; in stressed markets it inverts.
The term structure is one of the most quoted and least precisely read objects in volatility markets. Commentary routinely treats an inverted curve as a prediction of coming turbulence. It is better understood as the price schedule of insurance across time — the outcome of demand, supply and the mechanics of rolling positions, each of which leaves measurable marks on the curve.
How is the curve constructed?
VIX futures settle to the value of a special opening quotation of the VIX on their expiration date, and each contract's price is the market's current clearing level for that eventual settlement. Chain the contracts by expiration and you have the term structure. Two conventions matter immediately: the spot VIX and the front futures contract are different objects with different dates, and the curve's shape is conventionally read with spot alongside the front two or three expirations, since liquidity concentrates there.
Liquidity itself shapes the read. Front-month contracts dominate trading volume; deferred contracts trade wider and thinner. A curve drawn through illiquid back months is partly a construction of stale quotes, a caution that applies to any term-structure chart without volume data attached.
What does contango measure?
Contango — upward-sloping prices with later expirations higher — is the curve's habitual state in quiet markets. Its standard explanation combines two forces. First, sellers of volatility demand compensation for bearing crash risk over longer horizons, so deferred contracts embed a risk premium. Second, the spot VIX is mean-reverting in a way the market prices: when spot sits in the mid-teens, futures settle higher toward the long-run average of volatility rather than assuming the calm persists forever.
Contango has a mechanical consequence for anyone holding long-volatility positions through time. A fund long the front future and rolling it monthly buys each new contract at a premium to the one expiring, paying the slope as a recurring cost when the curve fails to move. Products tracking VIX futures indices have historically lost value in calm, steep-contango regimes for exactly this reason — the mathematics of the roll, not any single event.
What does backwardation measure?
Backwardation — front expirations pricing above spot, or spot above the whole curve — appears when immediate protection is in heavy demand relative to later dates. It is the curve's stress signature: the August 5, 2024 session, when spot VIX traded above 60 intraday, arrived with the front of the curve inverting as participants paid up for the nearest available insurance. Backwardation does not say turbulence will continue; it prices the current scramble for near-dated cover, and the curve can normalize within days if the scramble subsides, as it did in that episode.
Why do spot VIX and futures diverge at all?
Because they are prices for different things on different dates. Spot VIX is a 30-day implied volatility computed from S&P 500 options starting now; the front future is a claim on a 30-day volatility window starting at the future's expiration. Between them stands calendar time in which anything can happen, plus the hedging flows of dealers who are short options and long futures or the reverse. The basis between spot and front futures therefore moves with both information and flow, and attributing every basis move to information alone misprices the plumbing.
| Curve state | Shape | Typical regime | Standard mechanical read |
|---|---|---|---|
| Contango | Later expirations higher | Calm markets | Roll costs erode long-vol positions |
| Backwardation | Front pricing above spot and later months | Acute stress | Near-dated protection commands premiums |
| Flat / humped | Little slope or mid-curve bulge | Transitions, event dates | Ambiguous; check volumes and event calendar |
Where does reading the curve mislead?
Four failure modes recur. First, the curve is a price, not a forecast: inverted curves have resolved into calm weeks and steep contango has preceded crashes, so the shape's information is about current pricing, not destiny. Second, single-contract distortions — a pin at one expiration around a known event date — can hump the curve without any regime change. Third, products referencing the curve, from VIX ETPs to variance swaps, embed roll mathematics that dominate their returns in slope-heavy regimes; a view about volatility is not the same as a position in the futures curve. Fourth, chart conventions differ: some analysts plot spot against futures, others futures only, and the apparent slope changes with the choice.
Read precisely, the term structure is a record of what the market charges for volatility across horizons on a given day — a document, in prices, of how risk transfer is being priced. The Federal Reserve's market-functioning analyses during March 2020 documented the same object under stress; primary documentation of the contracts themselves is available through the listing exchange, and regulatory background on volatility products through investor.gov.
What should a reader ask before citing the curve?
Ask which contracts were plotted, whether spot is included, what the volume was in the deferred months being cited, and whether the claimed shape survived the choice of convention. A term-structure claim without its contract list is a picture without a caption. The curve rewards exact reading precisely because it is one of the few market objects whose entire content is a schedule of prices by date.