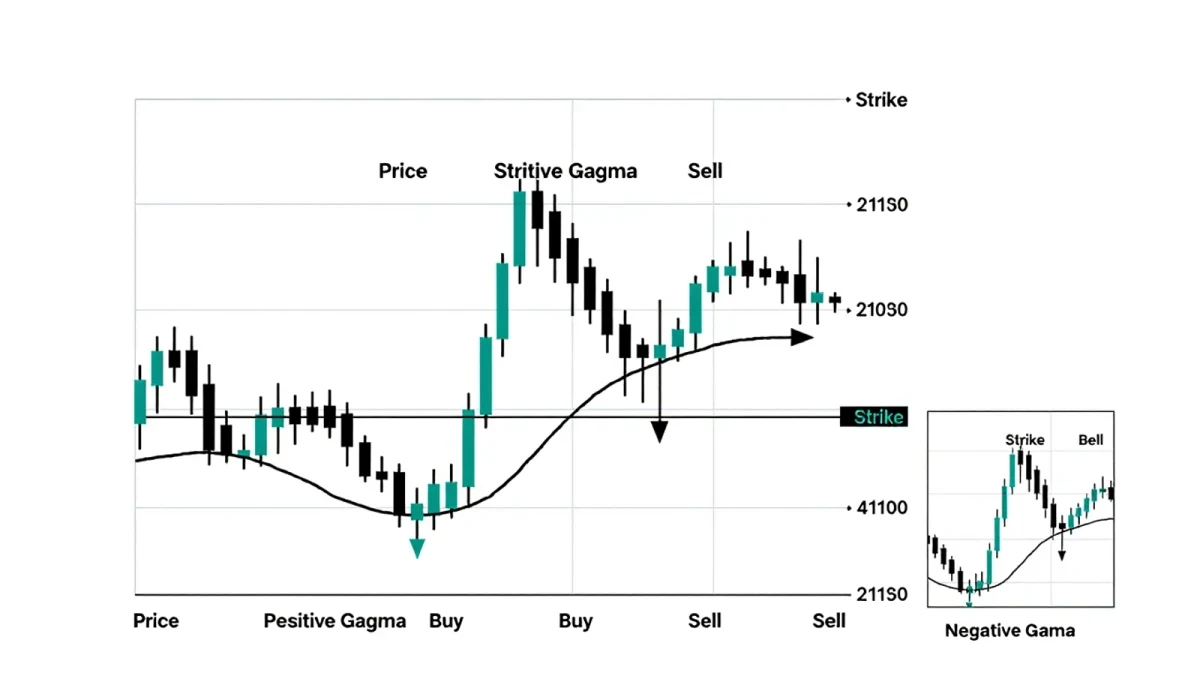
Dealer gamma exposure, commonly shortened to GEX, estimates the aggregate delta-hedging sensitivity of options dealers — how much futures or stock they must buy or sell per point the index moves — and the number circulates in two forms: a sign convention where positive gamma is said to damp volatility and negative gamma to amplify it. The estimate is built by summing dealer gamma across open options positions, which requires assuming who is long, who is short, and how they hedge; published GEX figures differ materially across data vendors precisely because those assumptions differ.
GEX has migrated from options desks to mainstream market commentary in a few years, usually as a single chart with zero marked as the boundary between calm and chaos. The underlying mechanics are real and worth learning. The aggregation into one headline number is where the epistemics get soft.
What is gamma, before it is aggregated?
Gamma is the second-order Greek: the rate at which an option's delta — its share-equivalent exposure — changes as the underlying price moves. A dealer running a delta-neutral book re-hedges as the market moves: if the book is long gamma, falling prices force buying and rising prices force selling, trades that mechanically lean against the move; if short gamma, falling prices force selling and rising prices force buying, trades that lean with it. This is the mechanical basis of the dampening-versus-amplifying language.
The hedge adjustments are real orders, but their size depends on each dealer's hedging style — how frequently they re-hedge, whether they hedge with futures or cash equities, and whether they run gamma against other exposures. None of that is visible in open-interest data.
How is the aggregate GEX number built?
The standard construction takes every open option on the index and its constituents, computes each contract's gamma from a pricing model, weights it by open interest and contract multiplier, and assigns a sign based on an assumed dealer position. The assumption step is the load-bearing wall: vendors typically assume dealers are short calls and long puts, or net short volatility overall, using heuristics that trace to work by SqueezeMetrics and later academic treatments of the dealer-community framework. Change the signing convention and the aggregate flips or shrinks. Change the input volatility — gamma itself depends on implied volatility through the model — and the number moves again without any flow having occurred.
Published GEX series therefore answer different questions depending on their builder. A figure described as "index GEX" may cover SPX options only, or SPX plus SPY, or constituents with a roll-up assumption. None of these choices is wrong; each produces a different statistic, and comparisons across vendors are comparisons across definitions.
What has been documented about positive and negative gamma regimes?
The documented regularities are modest and stated with conditions. Academic and practitioner studies have associated negative-dealer-gamma regimes with higher realized volatility and larger intraday reversals, and positive-gamma regimes with vol compression, on index data covering recent years. The effect direction is consistent with the hedging mechanics; the magnitudes are regime-dependent and the studies differ in construction. What the literature does not show is the strong causal reading popular in commentary — that GEX causes the market's direction or that zero-GEX crossings are events. A zero crossing is an artifact of where a particular aggregation sits that day, not a threshold in the market's rulebook.
Where does GEX fail as a measure?
Four structural limitations, stated plainly. First, dealer positioning is inferred, not observed: no exchange publishes who holds what, so the entire aggregate rests on signing assumptions that were estimated, not measured. Second, hedging behavior is heterogeneous and adaptive: dealers hedge at different frequencies, and the same book can be managed dynamically in fast markets, so the mechanical map from gamma to flow is a simplification of practice. Third, concentration: GEX is dominated by a small number of large strikes and expirations, so the aggregate can swing on positioning at two or three strikes, making it noisy as a daily indicator. Fourth, the model dependence of gamma itself — inputs like implied volatility move the estimate even when positions are unchanged.
| Component | Observable? | Assumption required | Effect if assumption is wrong |
|---|---|---|---|
| Open interest by strike | Yes, reported | None | — |
| Per-contract gamma | Computed | Model and volatility input | Weights shift with no flow |
| Dealer side of each position | No | Signing heuristic | Aggregate may flip sign |
| Hedging response | No | Frequency and instrument | Implied flow overstated or understated |
How should a reader treat a GEX chart?
As one estimated aggregate with a builder's name attached. Ask which contracts it covers, what signing convention it uses, and whether the vendor publishes revisions of its own series. Treat the positive-versus-negative framing as a conditional statistical association, not a mechanism that guarantees behavior — and treat any claim that GEX "will" pin or release a market as a forecast, which this site neither makes nor endorses. The Federal Reserve's surveillance publications on options markets and the Securities and Exchange Commission's market-structure filings at sec.gov are primary-document starting points for the observable pieces.
GEX is best read as a hypothesis about hedging flow, dressed in three decimal places. The hypothesis has documented, conditional support. The decimal places are borrowed from open-interest data and do not transfer their precision to the aggregation built on top of it.