The unemployment rate is the share of the labor force that is unemployed, where "unemployed" has a specific, narrow meaning: no job, an active recent search for one, and current availability to start. People without work who do not meet all three conditions are not in the unemployment count at all. So the rate is a precise measure of one slice of labor-market distress, not a measure of everyone who wishes they had a job.
That definition comes from a monthly household survey, not from benefit claims. The Bureau of Labor Statistics publishes the results, including seasonally adjusted rates for every state — in its latest table, for example, Wisconsin at 3.2 percent and California at 5.1 percent, both marked (p) for preliminary. The (p) matters: these are first estimates, subject to revision.
This article explains how the number is built, who falls inside and outside it, and why it can move in directions that seem to contradict other labor data. The short version for readers who want the takeaway now: treat the unemployment rate as a well-measured but tightly defined indicator, and always ask what denominator it is using. Compared to what, and who is missing, are the two questions that do the most work.
How is the number actually built?
The rate comes from a survey of households, run jointly by the Census Bureau and the Bureau of Labor Statistics. Each month, interviewers ask a rotating sample of households a set of questions about everyone of working age: did they work last week, for pay or unpaid in a family business; if not, did they look for work; when; and could they start a job. The answers sort each person into employed, unemployed, or not in the labor force.
The denominator is the labor force, not the adult population. The labor force is everyone employed plus everyone unemployed by the survey's definition. That choice is the single most important thing about the number. If discouraged workers stop looking and drop out of the labor force, the unemployment rate can fall even though no one found a job. The rate is a ratio, and both the numerator and the denominator can move.
Because a household sample is a sample, the published figure is an estimate with sampling error, and small month-to-month moves are often noise. State-level rates carry wider error than the national rate. The BLS also adjusts the figures for normal seasonal patterns — hiring waves, summer exits, holiday hiring — which is why the seasonally adjusted number differs from the raw one. Seasonal adjustment itself gets re-estimated, one reason economic data keeps getting revised after release. Readers following this should also see Why economic data keeps getting revised after release.
Who counts as unemployed — and who doesn't?
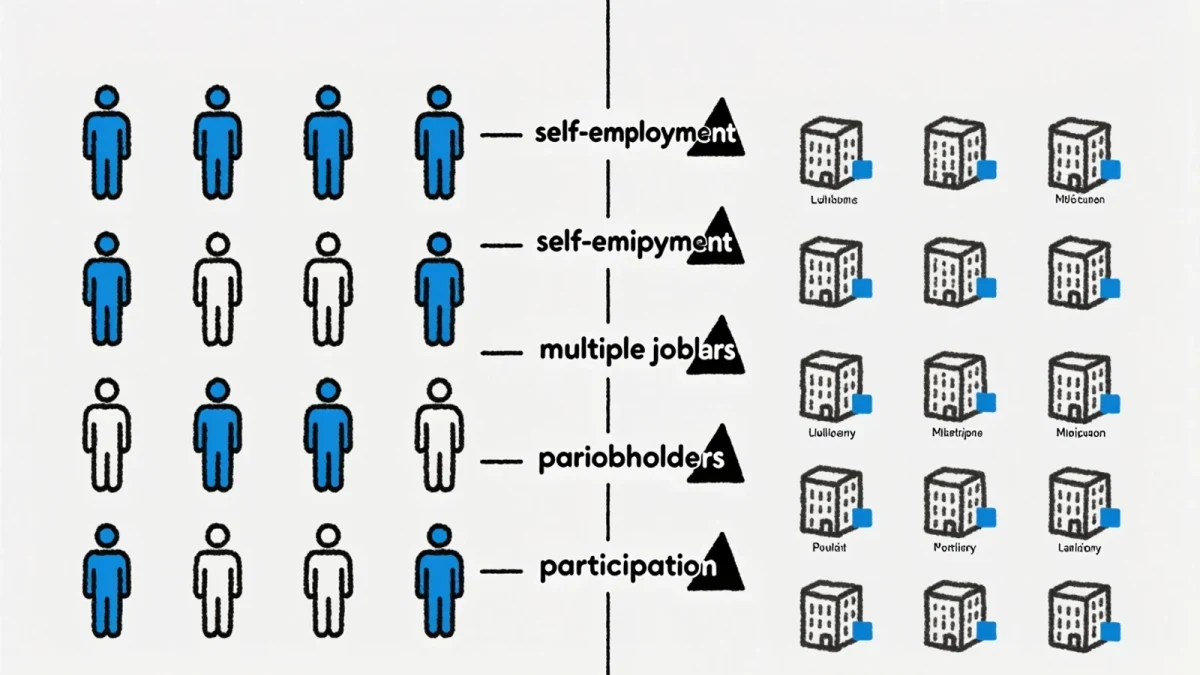
The survey's definition of unemployed has three parts. A person must have no employment, must have made an active effort to find work within a recent look-back window, and must be available to take a job. Miss any part, and the person is classified as out of the labor force rather than unemployed.
That classification excludes several groups readers often assume are included. People who wanted work but gave up searching are not unemployed in this measure. People who are underemployed — working part-time when they want full-time — count as employed. People whose work search is passive, such as only browsing postings without applying, may not register as actively searching. None of this makes the survey wrong; it makes it narrow. The rate answers one question — how many people in the labor force are jobless and actively seeking — not the broader question of how much of the population's available work capacity is unused.
The Bureau of Labor Statistics publishes broader alternative measures that widen the net, adding discouraged workers and the underemployed. Those series are useful exactly because the headline rate is not designed to capture them. Reading the headline alone, without knowing its edges, is where most misinterpretation starts.
Why doesn't the rate match who gets benefits?
A common assumption is that the unemployment rate counts people receiving unemployment insurance. It does not. The two systems are separate: one is a household survey, the other is an administrative benefits program. There is no federal unemployment program; each state runs its own, and USAGov notes that states set their own eligibility rules, which commonly require earnings and work history over a recent period and an ongoing job search.
Because eligibility is state law, not survey definition, the overlap between the two is partial in both directions. Some unemployed people by the survey definition do not qualify for benefits — their earnings or work history may fall short, or they may have left a job in circumstances their state does not cover. The Department of Labor describes the federal-state program as serving workers unemployed "through no fault of their own," a determination made under each state's law. Meanwhile, some benefit recipients are not unemployed by the survey's definition, such as people working reduced hours while drawing benefits. Neither number is a census of the other.
Weekly claims data is still useful. It is timely and it measures a different thing — new applications for help — which is why analysts read the two together rather than treating either as a check on the other. The gap between them is itself information, and we cover one version of it in Why the unemployment rate and payrolls can tell opposite stories. This connects to our earlier piece, Why the unemployment rate and payrolls can tell opposite stories.
What does the rate miss in practice?
Three misses matter most for interpretation. First, labor-force participation: anyone neither working nor actively searching sits outside the denominator entirely, so a falling rate can reflect exit as easily as hiring. Second, hours and skills: a full-time worker cut to part-time is employed; a chemical engineer driving a delivery route is employed. The rate is blind to both mismatches. Third, geography and composition: a national rate averages very different state labor markets — the BLS's own current table spans roughly two percent in the lowest states to above five percent in the highest — so the national figure can be calm while a specific region is not.
A fourth, quieter miss is measurement timing. The survey references a specific week each month. A layoff announced mid-month may not appear in that month's rate at all. Combined with sampling error and seasonal adjustment, this is why one month's print should be read as a noisy estimate, not a verdict.
What this means for reading the number
Our analysis, based on how the measure is constructed: the unemployment rate is one of the best-executed statistics in economics, and one of the worst-named. It is not "the unemployment rate" in the everyday sense of the word; it is the active-search unemployment rate, measured against the labor force. The practical reading discipline is short:
- Check whether the change came from hiring or from people leaving the labor force. The rate alone cannot tell you.
- Pair it with participation and with broader underemployment measures before drawing a conclusion about labor-market health.
- Prefer multi-month trends to single prints, and remember state rates are preliminary estimates.
- Never compare it to benefit claims as if one should equal the other. They measure different populations by design.
For readers tracking how official statistics get built and revised, the same discipline applies across the data calendar — see How is the CPI actually measured? and What do consumer confidence surveys actually measure?. Every headline economic number is a survey or an estimate with a definition attached, and the definition is where the meaning lives.
Where the evidence stops
What the sources establish: the survey-based definition of unemployment, the labor-force denominator, the separation between the rate and the state-run benefits system, and the preliminary status of current state figures. What they do not establish: any current reading of labor-market health, any forecast of where the rate goes next, and any conclusion about whether today's level is good or bad. Those are judgments this article deliberately does not make. The rate is a measurement question; whether the measured level calls for any action is a separate question, and it is not answered by the statistic itself.